Introduction
Richard Wyckoff spent decades reading the tape before there were charts to read. What he wrote down — three laws, a mental model called the Composite Man, and a repeating four-phase cycle — is still how a lot of serious price-and-volume analysis gets done today, whether or not the trader has ever heard his name.
This guide walks through the method in the order Wyckoff himself is usually taught: the three laws, the Composite Man, the four-phase cycle, the accumulation and distribution schematics (the letter-labelled events inside a range), how to read volume against price, and — honestly — how the modern "supply zone / demand zone" language traders use today relates to what Wyckoff actually wrote.
None of this is a signal service. A schematic shows what a range can look like; it does not promise that any specific range will resolve the same way. Educational content only — not financial advice.

Who was Richard Wyckoff
Richard Demille Wyckoff (born 2 November 1873, died 7 March 1934) was an American stock-market operator, trader and financial writer. He started on Wall Street in 1888 at age 15 as a runner/office boy for a brokerage — a career built from reading the tape on the floor, not from an academic theory — and ran his own trading operation while still in his 20s.
In 1907 he founded a financial magazine called The Ticker; it was renamed The Magazine of Wall Street in 1911 and grew into one of the widest-circulation financial publications of its era, reportedly reaching over 200,000 subscribers at its peak. He also wrote under the pen name Rollo Tape, including the 1910 book Studies in Tape Reading, and later How I Trade and Invest in Stocks and Bonds (1924).
In 1931 he published a correspondence course that laid out his method systematically; that course became the basis of the Stock Market Institute he founded to teach it directly. He is commonly grouped with Charles Dow, W. D. Gann, Ralph Nelson Elliott and Robert Rhea as one of the early "titans" of technical analysis — a grouping worth noting, not a formal title.

The three laws
Law of supply and demand. Price rises when demand exceeds supply and falls when supply exceeds demand. This is the plainest of the three, and it is the reason every other Wyckoff idea exists: everything else is a way of estimating which side is heavier before the price move makes it obvious.
Law of cause and effect. A trading range is the "cause" — time and effort spent building a position. The trend that follows is the "effect" it pays for. Wyckoff traders use the width of a range (often measured with point-and-figure counts) to estimate how far the resulting move could travel; a longer, more thoroughly built range implies a larger potential effect.
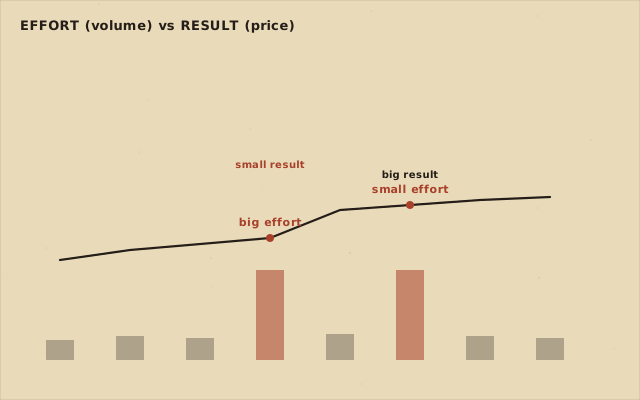
Law of effort versus result. Volume is effort; price movement is result. When a large volume push produces only a small price move, that mismatch is a sign that the other side is absorbing supply (or demand) — the current move is running low on fuel. Divergence between effort and result is one of the method's main ways of reading a market from the inside, not just the outside.
The Composite Man
Wyckoff taught his students to read every fluctuation in the market, and in any one stock, as if it were the result of one giant, well-informed operator planning a campaign — he called this device the Composite Man. It is a teaching tool, not a claim that a literal cartel controls markets: it gives a trader a consistent character to read the tape through, someone who accumulates quietly before a rise and distributes quietly before a fall.
The practical use of the idea is simple: don't fight what the tape is showing you. If price and volume behave like informed money is building a position inside a range, the Composite Man frame says to look for the range to eventually resolve upward — and vice versa for distribution.
The four-phase market cycle
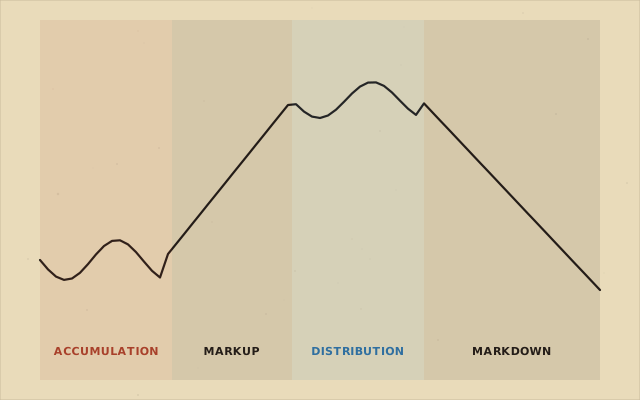
Wyckoff's cycle has four phases that repeat: Accumulation — informed money buys inside a range after a decline, quietly, without pushing price far. Markup — the range resolves and price trends up. Distribution — informed money sells inside a range after the rise, again without pushing price far in the other direction yet. Markdown — the range resolves down and price trends down. Each markup or markdown is itself the "effect" whose "cause" was the range that preceded it.
Accumulation schematic: phases A–E
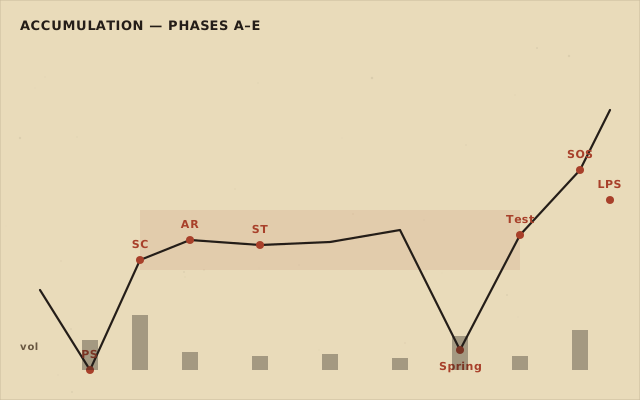
The classic accumulation schematic breaks the range into lettered phases and events. Phase A — stopping the downtrend: Preliminary Support (PS), where buying starts to appear against the decline; Selling Climax (SC), a sharp, high-volume drop where panic selling meets absorption; Automatic Rally (AR), the reflex bounce off the SC low; Secondary Test (ST), a retest of the SC area, ideally on lighter volume.
Phase B — building the cause: price ranges between the AR high and ST low(s) while the Composite Man accumulates a position. Multiple tests can occur; this phase is often the longest.
Phase C — the test: the Spring, a false breakdown below the range's support that shakes out weak holders before reversing back inside the range — followed by a Test, a lower-volume retest confirming supply has dried up. Not every accumulation has a Spring; when one occurs it is the classic "shakeout."
Phase D — confirming the trend: Sign of Strength (SOS), a strong advance through resistance on increasing volume; Last Point of Support (LPS), a shallow pullback that holds higher than prior lows, showing supply is exhausted.
Phase E — markup: price leaves the range decisively; a Backup (BU) — sometimes called a back-up to the edge of the creek — can occur as a brief pullback to the broken resistance before the trend continues.
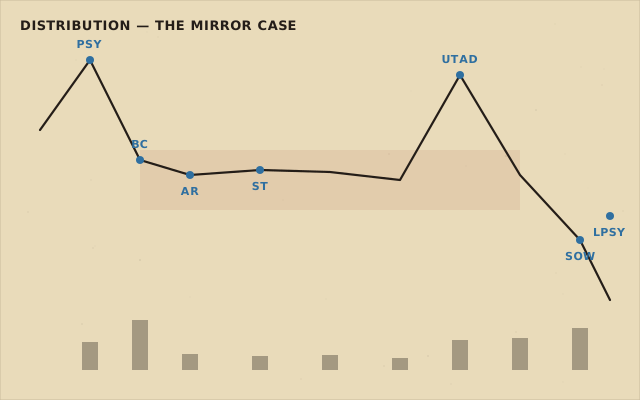
Distribution schematic: the mirror case
Distribution is the mirror image of accumulation, at the top of a rise. Preliminary Supply (PSY) — early selling appears against the advance; Buying Climax (BC) — a sharp, high-volume top where euphoric buying meets distribution; Automatic Reaction (AR) — the reflex drop off the BC high; Secondary Test (ST) — a retest of the BC area.
Inside the range, Upthrust (UT) or its more decisive form Upthrust After Distribution (UTAD) is the mirror of the Spring: a false breakout above resistance that fails and turns back down, trapping late buyers. Sign of Weakness (SOW) is a break down through range support on rising volume, and Last Point of Supply (LPSY) is a weak rally that fails to reclaim the range, showing demand is exhausted before markdown begins.

Reading volume
Volume is how Wyckoff traders check whether a price move is genuine. A rally on rising volume through resistance (SOS) is more convincing than one on thin volume. A breakdown that fails to bring in heavy selling volume (a Spring) is more likely a shakeout than a real change of trend. The general rule from the law of effort vs. result: big volume with little price progress means the move is being absorbed by the other side, and the current trend is more likely near exhaustion than continuation.
How “supply/demand zones” relate to Wyckoff
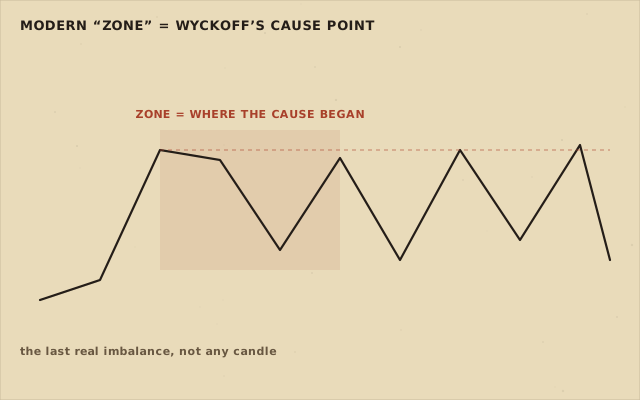
This is a modern term, not Wyckoff's own. "Supply zone" and "demand zone" are phrases popularized by later price-action and smart-money-concepts (SMC) trading content; Wyckoff himself did not use that verbatim language. What is genuinely his is the underlying idea: a zone is where the last real imbalance began — the last point before price moved away with effort, which is why price often reacts there again.
In Wyckoff's own vocabulary, that origin point is closer to a cause point: the edge of a range where accumulation or distribution actually happened, not just any candle that happens to look like a turning point. Traders who mark a "zone" and then check it against a Wyckoff schematic — is this the edge of a real range? did volume behave like absorption there? — are doing something closer to the original method than traders who mark a zone from price shape alone.
The honest summary, in the words the film's own outro uses: the words are new, the idea is Wyckoff's.
A practical checklist
- Context — what is the larger trend, and where is this range sitting relative to it (after a decline, after a rise, or mid-trend)?
- Range — mark the actual high and low of the trading range, not a guess. Note how long it has taken to build (the "cause").
- Event — identify the specific event inside the range: a Spring/Test in accumulation, an Upthrust/UTAD in distribution, an SOS or SOW.
- Confirmation — wait for the next bar(s) to confirm the event with volume that fits the story (light on a Spring's low, rising on an SOS).
- Risk and stop — place the stop beyond the zone, past the wick that made it, not tight inside it — a Spring or Upthrust wick is exactly the kind of move that would stop out a tight, inside-the-zone order.
- Invalidation — decide in advance what price action would prove the read wrong (for example, a Spring low being decisively broken on volume, rather than just touched).
Common mistakes
- Marking a "zone" from price shape alone, without checking whether it is the edge of a real range where volume behaved like accumulation or distribution.
- Treating every break of a range as a Spring or Upthrust — most breaks are just breaks; the label only applies once the reversal and lighter/heavier volume pattern actually show up.
- Entering on the shakeout itself instead of waiting for confirmation — a Spring can keep springing lower before it turns.
- Placing the stop just inside the zone, where the wick that defines the zone will hit it.
- Skipping context — reading a Spring the same way whether it appears after a long decline (more credible) or in the middle of a trading range with no prior cause (less credible).

Glossary
- Composite Man
- A teaching device: reading the market as if one informed operator plans every campaign.
- Cause and effect
- A range is the cause (time/effort spent); the trend that follows is the effect it pays for.
- Effort vs. result
- Comparing volume (effort) with price movement (result) to spot absorption and exhaustion.
- Preliminary Support (PS)
- Early buying that starts to appear against a decline, before the climax.
- Selling Climax (SC)
- A sharp, high-volume drop where panic selling meets absorption.
- Automatic Rally (AR)
- The reflex bounce off the selling-climax low.
- Secondary Test (ST)
- A retest of the climax area, ideally on lighter volume.
- Spring
- A false breakdown below range support that shakes out weak holders before reversing up.
- Test
- A lower-volume retest confirming supply (or demand) has dried up.
- Sign of Strength (SOS)
- A strong advance through resistance on rising volume.
- Last Point of Support (LPS)
- A shallow pullback holding above prior lows, showing supply is exhausted.
- Backup (BU)
- A brief pullback to broken resistance before markup continues.
- Preliminary Supply (PSY)
- Early selling that starts to appear against an advance, before the climax top.
- Buying Climax (BC)
- A sharp, high-volume top where euphoric buying meets distribution.
- Upthrust (UT) / UTAD
- A false breakout above resistance that fails and turns back down, trapping late buyers.
- Sign of Weakness (SOW)
- A break down through range support on rising volume.
- Last Point of Supply (LPSY)
- A weak rally that fails to reclaim the range, showing demand is exhausted.
- Demand / supply zone
- Modern term (not Wyckoff's own) for the area where the last real imbalance began.
Frequently asked questions
What is the Wyckoff method?
A way of reading price and volume together, built by Richard Wyckoff from decades of tape reading. It rests on three laws — supply and demand, cause and effect, effort versus result — and uses a repeating four-phase cycle (accumulation, markup, distribution, markdown) to frame where a market is.
Who was Richard Wyckoff?
An American stock-market operator and financial writer (1873–1934) who started as a Wall Street runner at 15, founded The Ticker (1907, renamed The Magazine of Wall Street in 1911), and in 1931 published the course that became the Stock Market Institute.
What is the Composite Man?
A teaching device: read the market as if one giant, well-informed operator were behind every campaign of accumulation and distribution. It is a mental model for thinking like informed money, not a claim that a literal cartel controls markets.
What is a Spring in Wyckoff analysis?
A false breakdown below an accumulation range's support that shakes out weak holders before price reverses back inside the range and, often, trends up. It is usually followed by a lower-volume Test that confirms supply has dried up.
What is an Upthrust or UTAD?
The mirror of a Spring, inside distribution: a false breakout above resistance that fails and turns back down, trapping buyers who chased the breakout. UTAD (Upthrust After Distribution) is its more decisive form.
Are "demand zone" and "supply zone" Wyckoff's own terms?
No. They are later phrases from modern price-action and smart-money-concepts trading content. The underlying idea — that price reacts at the point where the last real imbalance began — does trace back to Wyckoff's cause-and-effect thinking, even though he never used that exact wording.
How does volume confirm a Wyckoff pattern?
Through the law of effort vs. result: a genuine breakout should come with rising volume, while a shakeout (Spring or Upthrust) typically shows volume that doesn't match the size of the price move, meaning the other side is absorbing it rather than a real trend change happening.
Is the Wyckoff method a guaranteed trading system?
No. It describes patterns that recur often enough to be worth studying, not a signal that guarantees any outcome. Every idea here needs confirmation and a stop placed beyond where the read would be proven wrong. Educational content only — not financial advice.
Sources
- Richard Wyckoff · Wikipedia
Biography, dates and career overview. - The Wyckoff Method: A Tutorial · StockCharts ChartSchool
Three laws, Composite Man, accumulation/distribution schematics. - About Wyckoff · Wyckoff Stock Market Institute
The Ticker, Magazine of Wall Street, 1931 course and Institute. - Original Wyckoff Stock Market Institute Course (1931) · Wyckoff Stock Market Institute
Primary source for the 1931 correspondence course. - Wyckoff Method · Wyckoff Analytics
Composite Man quotation and campaign framing.