
Wilder's 1978 measuring toolkit
John Welles Wilder Jr. was born in Norris, Tennessee, on 11 June 1935. He earned a mechanical-engineering degree in 1962, worked in engineering, and moved into real-estate development. In a later interview he described selling his interest in apartment projects and, at age 38, turning seriously to commodity trading and technical analysis. That career path helps explain the engineering character of his indicators: define a quantity, smooth it consistently, then assign it one job. [1][2]
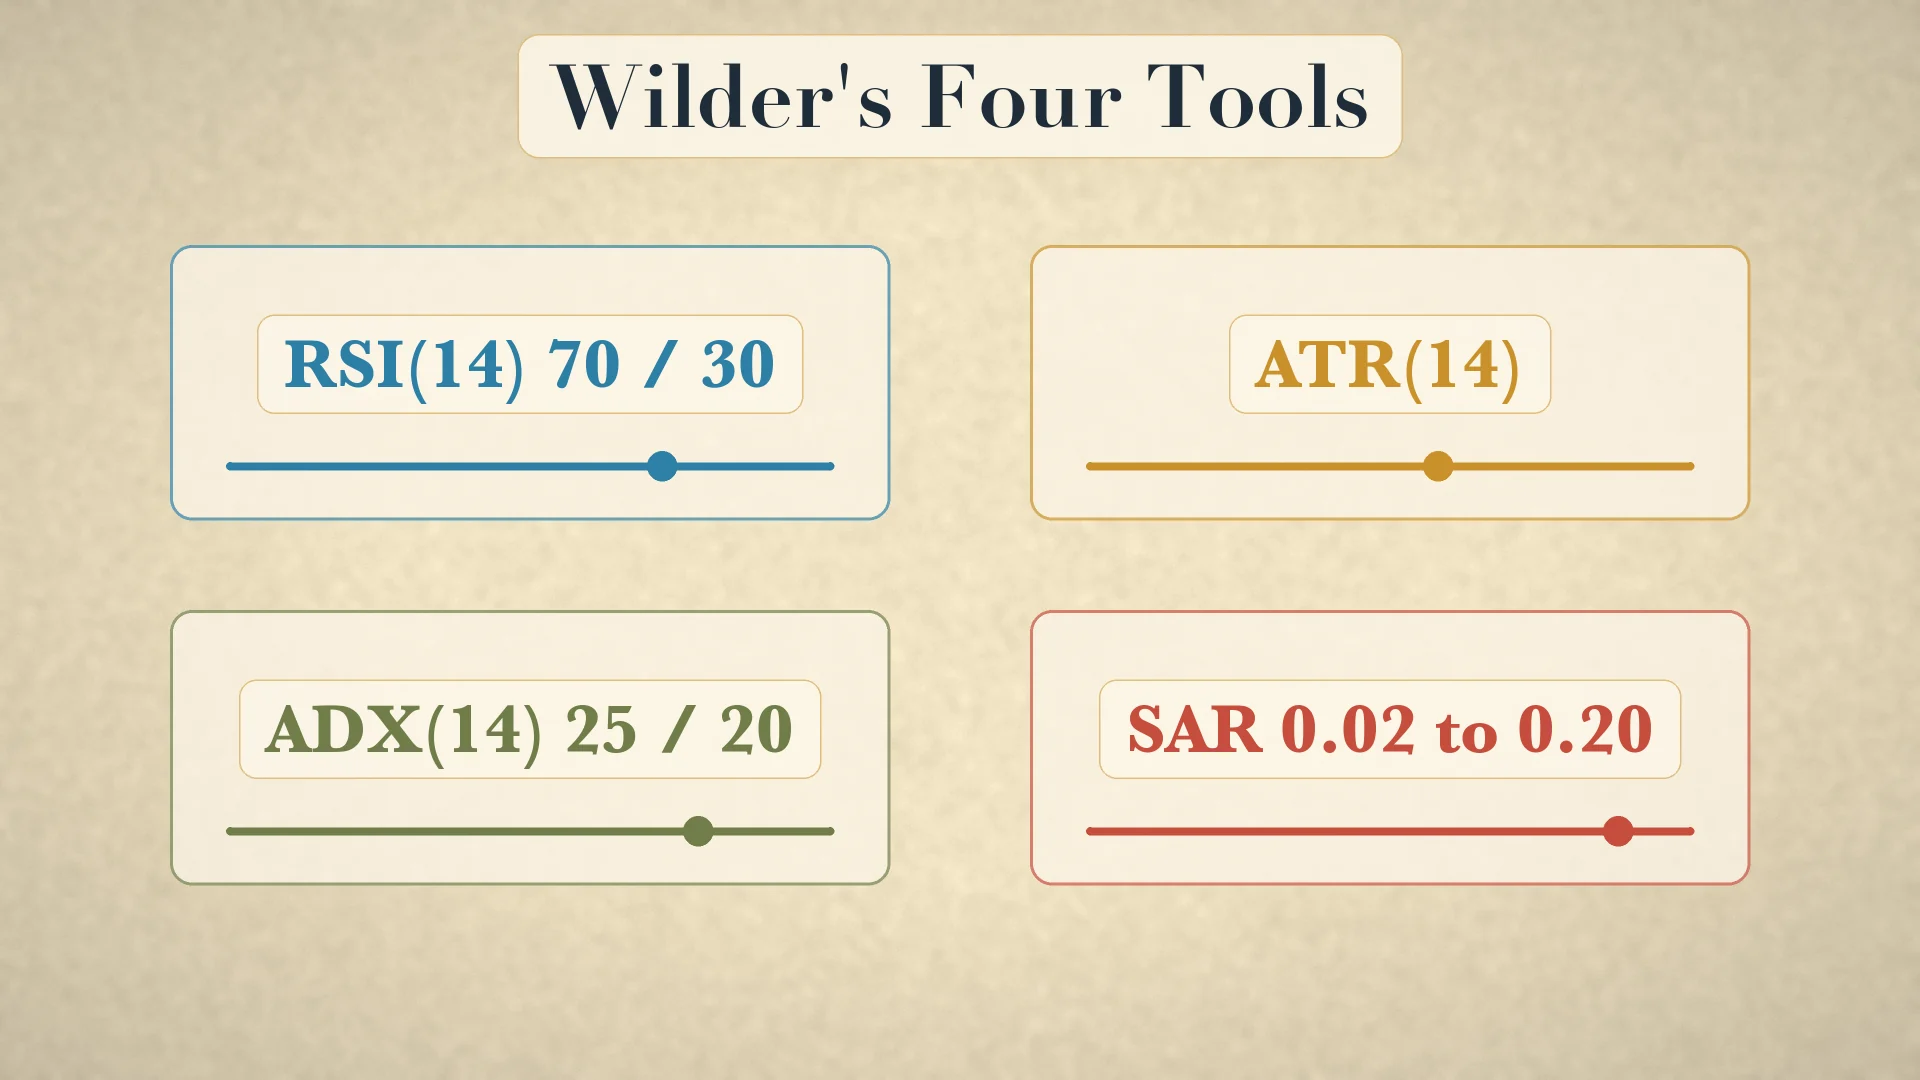
Wilder self-published New Concepts in Technical Trading Systems through Trend Research in Greensboro in 1978. The book introduced the Parabolic Time/Price System, the Volatility System, the Directional Movement System, the Swing Index System and RSI. This guide focuses on four connected tools—RSI, True Range/ATR, ADX/DMI and Parabolic SAR—but they were not the book's only concepts. [1][3]
Keep the jobs separate. RSI measures momentum on a bounded scale. ATR measures movement size without direction. +DI and −DI express directional movement while ADX summarizes its strength. Parabolic SAR trails a trend with an accelerating stop. Problems begin when a user asks one tool to do another tool's job—for example, treating high ATR as bullish or treating ADX as direction.
RSI step by step: changes, averages, RS and the 0–100 scale
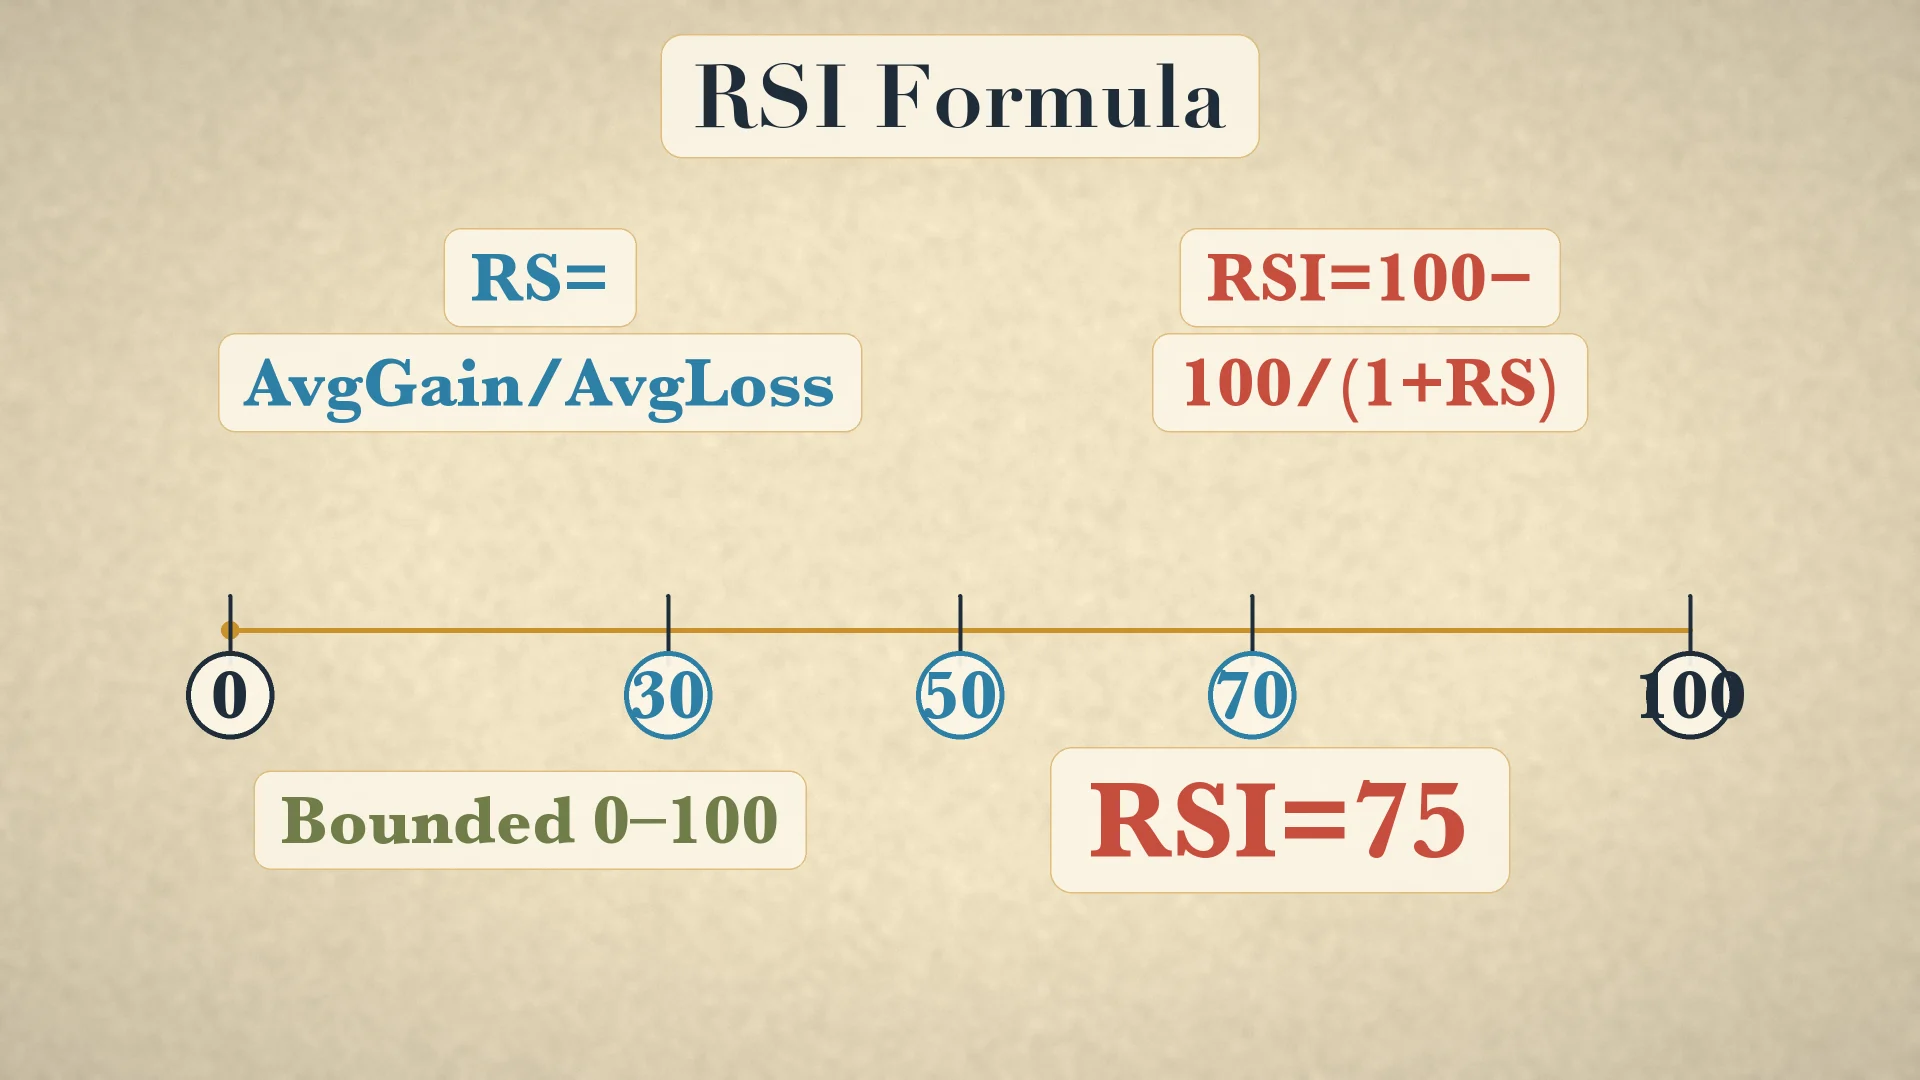
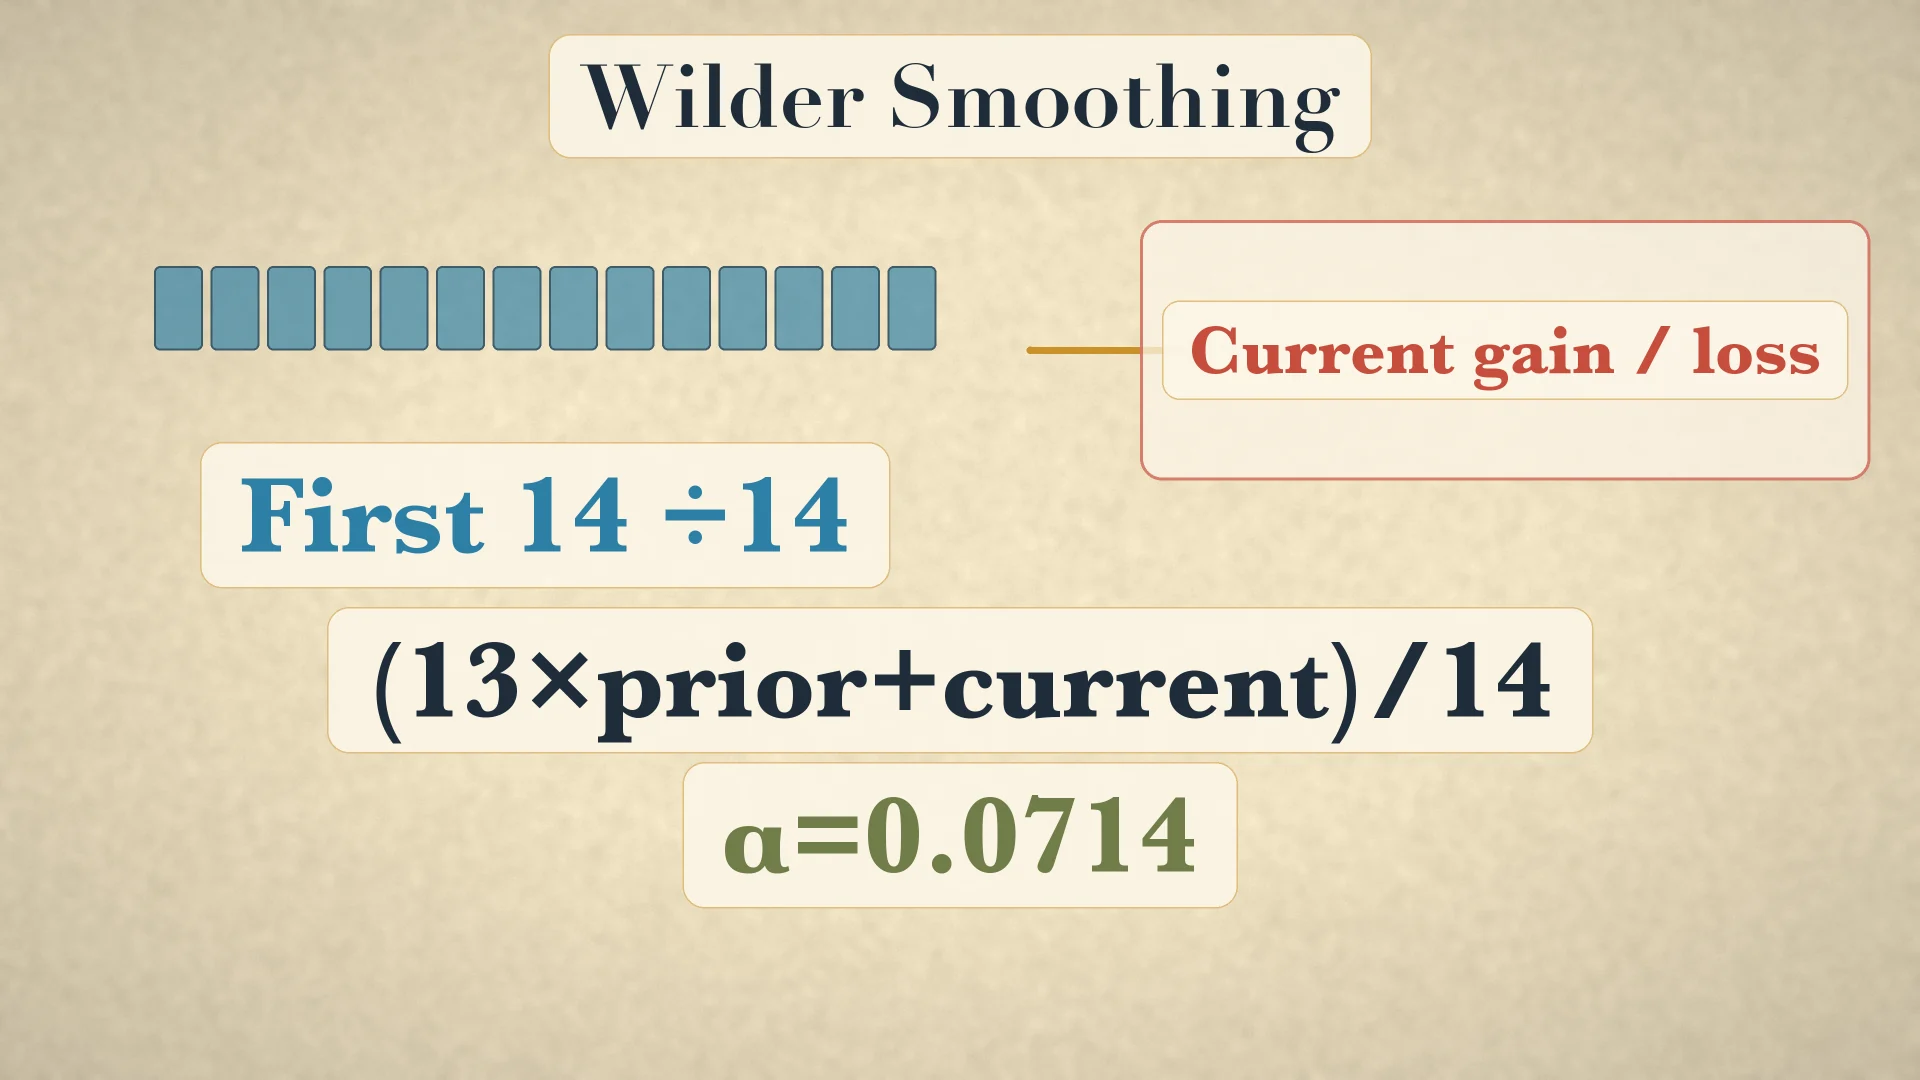
RSI starts with close-to-close changes. For each period, Gain = max(Close_t − Close_(t−1), 0) and Loss = max(Close_(t−1) − Close_t, 0). Up periods have a positive gain and zero loss; down periods have zero gain and a positive loss. For the original 14-period setting, seed AvgGain with the sum of the first 14 gains divided by 14 and seed AvgLoss the same way. Thereafter use Wilder smoothing: AvgGain_t = (13×AvgGain_(t−1)+Gain_t)/14 and similarly for losses. [4]
Worked RSI calculation
- Assume the 14-period seed totals are 14 points of gains and 7 points of losses.
- Seed
AvgGain=14/14=1.00; seedAvgLoss=7/14=0.50. - Compute
RS=1.00/0.50=2.00. - Compute
RSI=100−100/(1+2)=66.67. - If the next change is a 2-point gain, new AvgGain is
(13×1+2)/14=1.0714; new AvgLoss is(13×0.5+0)/14=0.4643. - New
RS≈2.3077, so newRSI≈69.77.
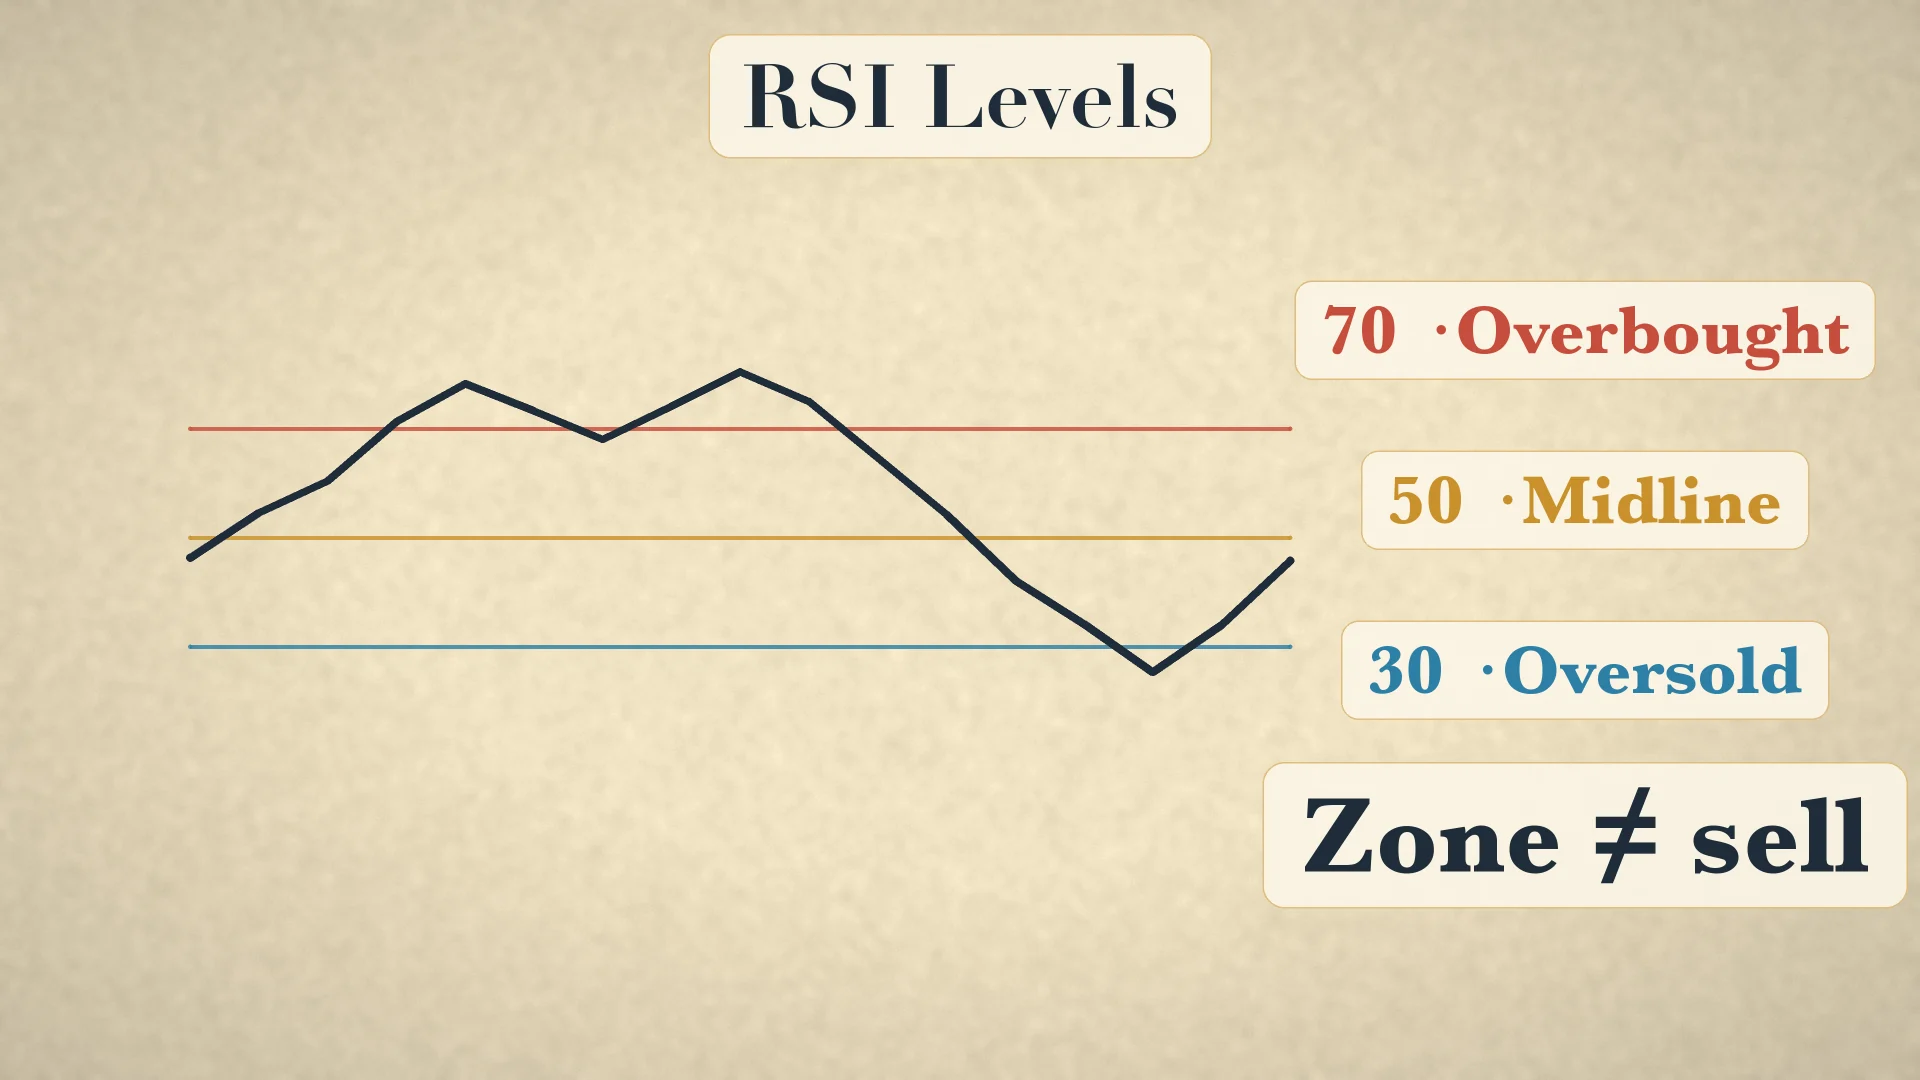
Traditional 70 and 30 levels describe overbought and oversold zones; they are not automatic orders. RSI can remain above 70 in a strong uptrend or below 30 in a strong downtrend. The 50 midline can help organize momentum context, but the fact boundary does not turn it into a guaranteed signal.
Failure swings and divergence are warnings, not forecasts
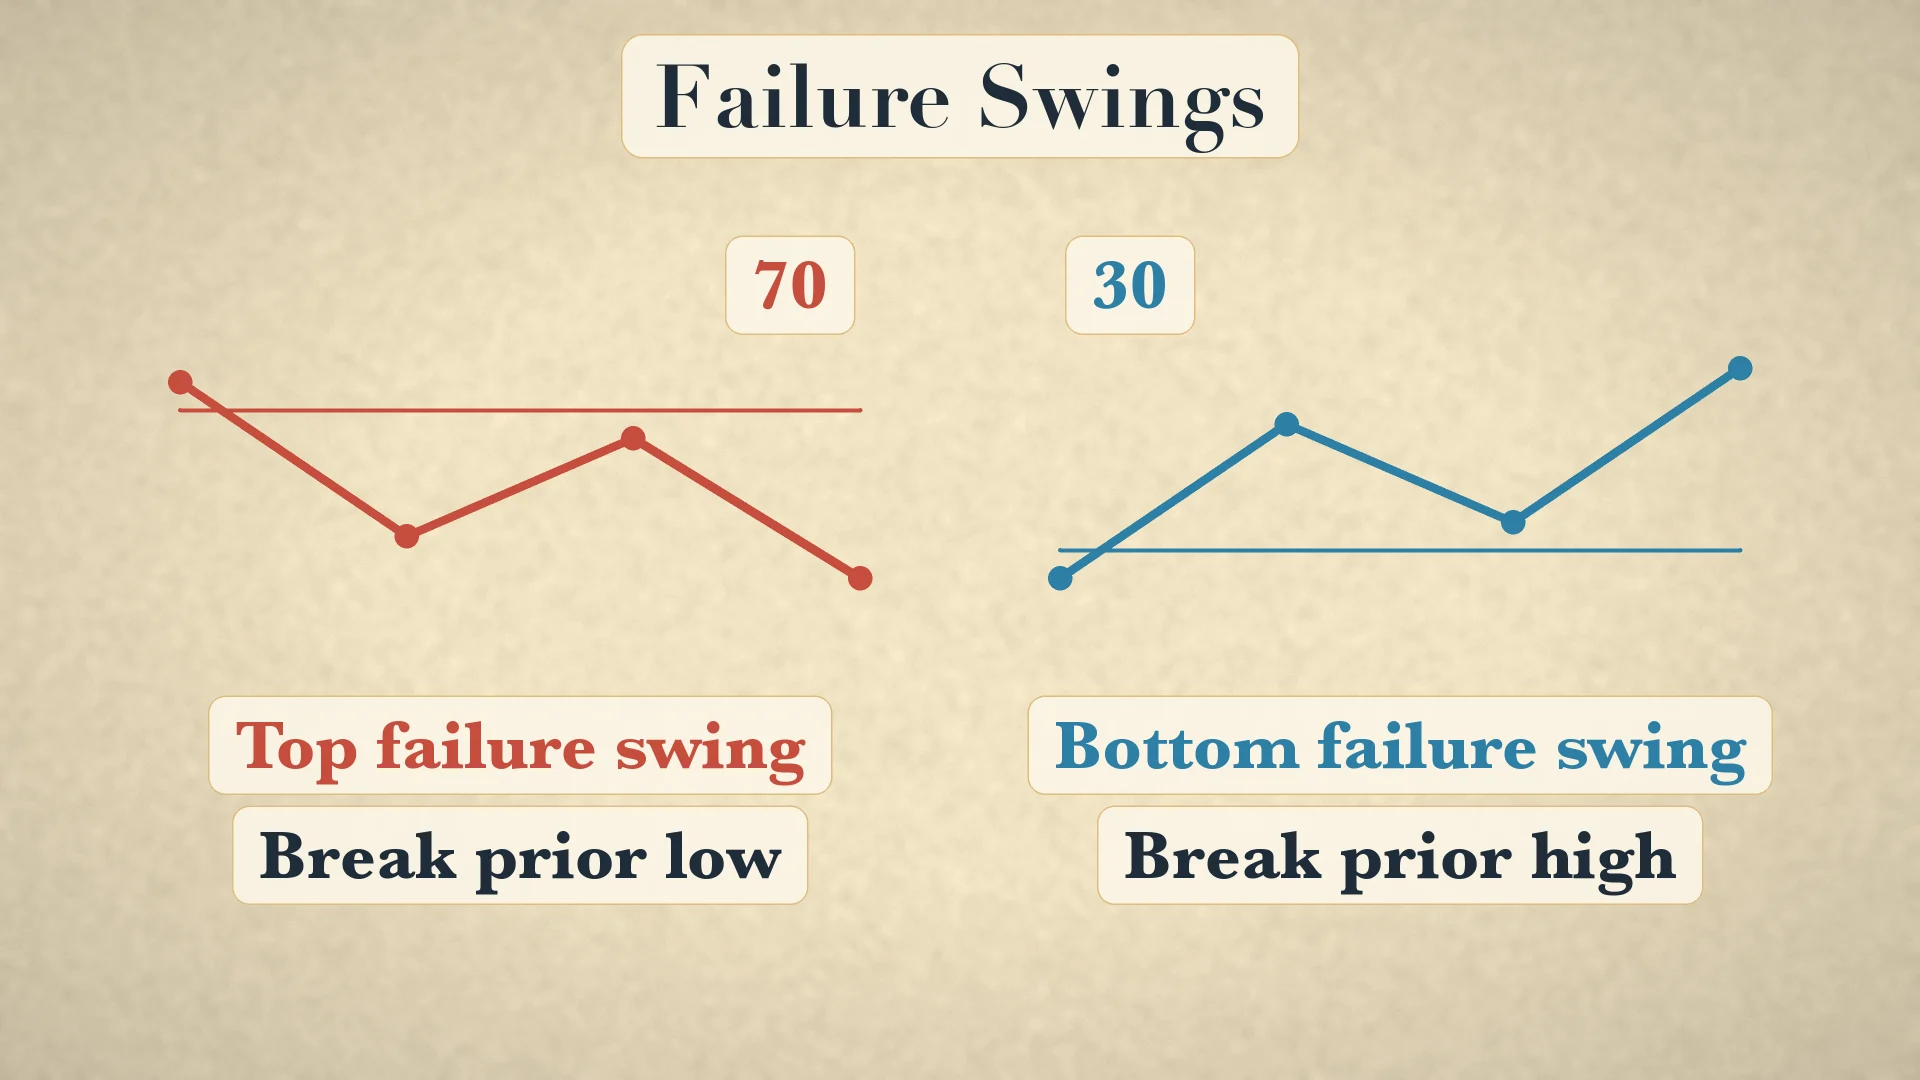
A bearish or top failure swing is an RSI-only sequence: RSI rises above 70, pulls back, forms a lower RSI high, then breaks below the intervening RSI low. A bullish or bottom failure swing mirrors the sequence below 30: an initial low, a bounce, a higher RSI low, then a break above the intervening RSI high. The final break completes the pattern; merely touching 70 or 30 does not. [4]
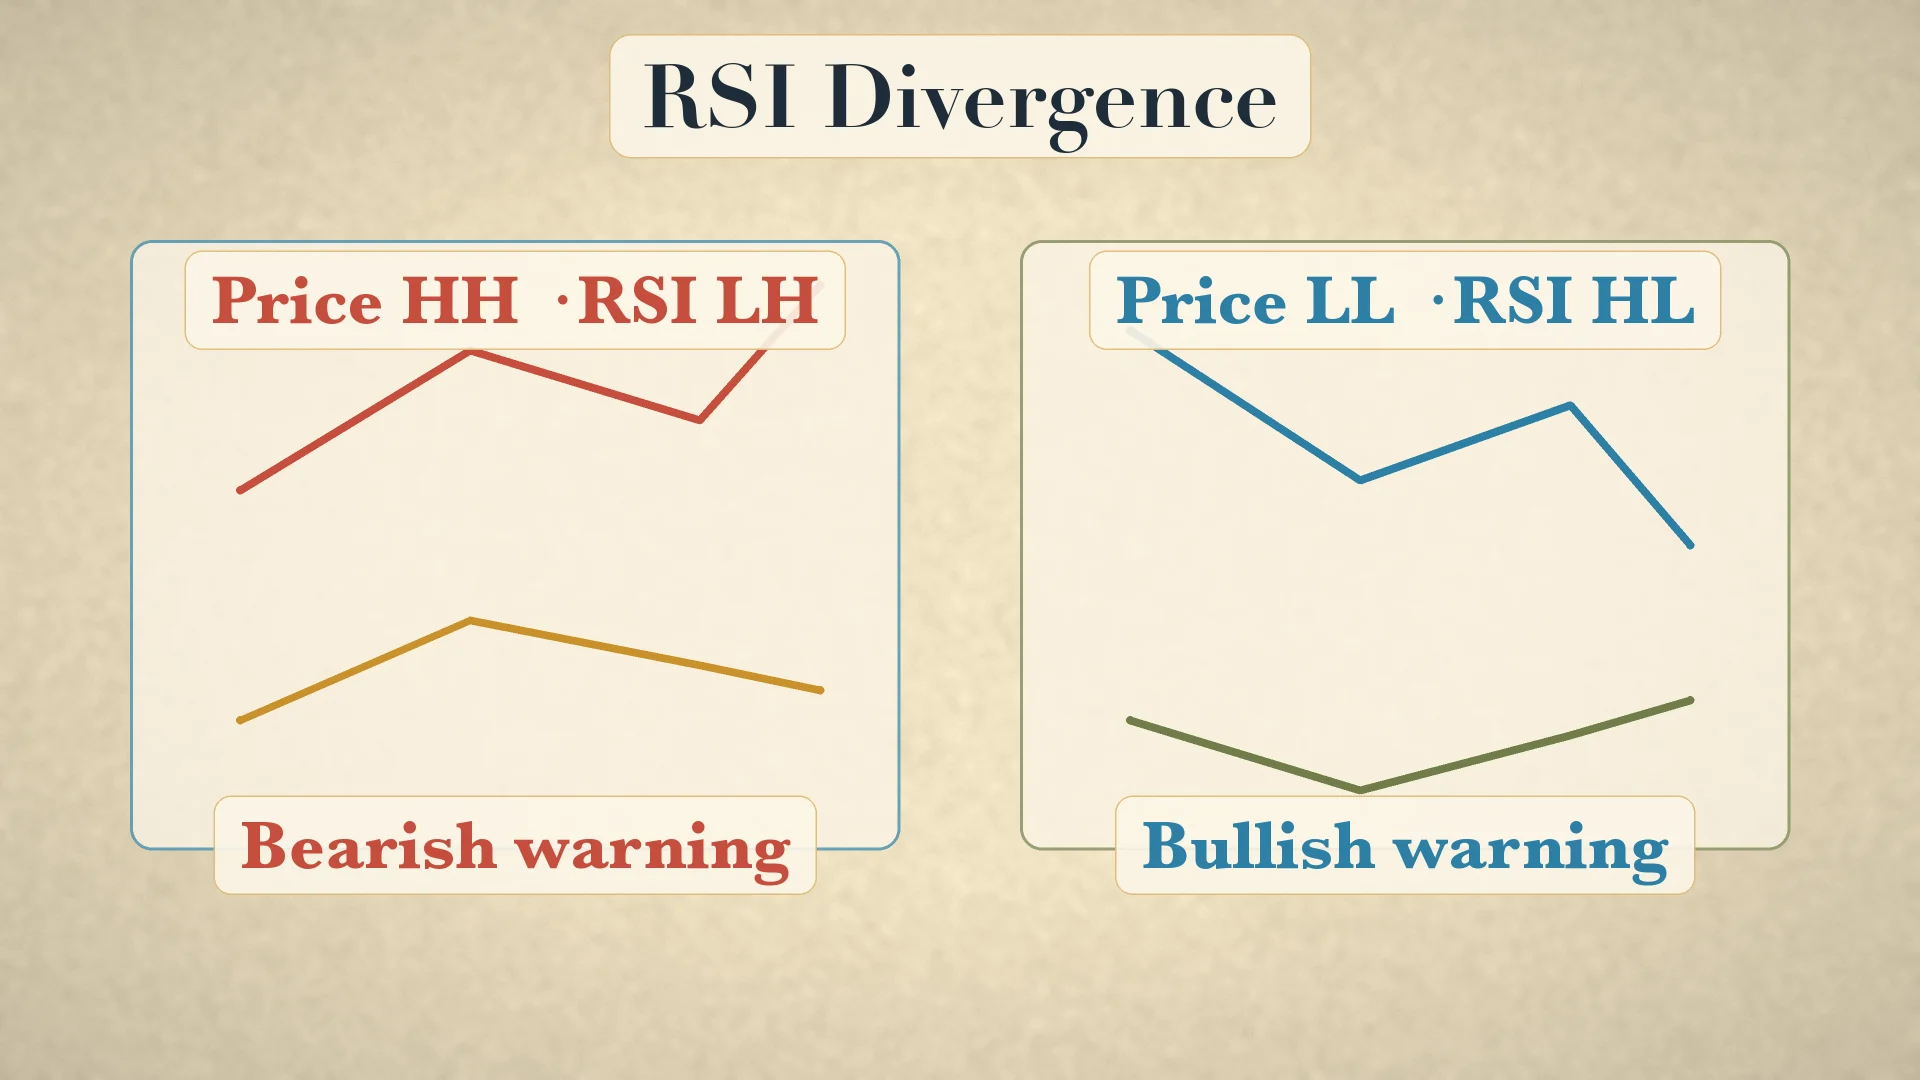
Divergence compares price with RSI. Price making a higher high while RSI makes a lower high is a bearish warning. Price making a lower low while RSI makes a higher low is a bullish warning. Warning is the right word: divergence can persist, fail, or appear while price continues in the same direction. A chart workflow can therefore require price structure to break before treating divergence as an entry study.
Worked top failure swing
- RSI reaches 74, placing it above the traditional 70 zone.
- It pulls back to 62; this becomes the intervening RSI low.
- It rebounds only to 69, a lower RSI high.
- It then falls to 61, breaking below 62 and completing the top failure-swing sequence.
- Price confirmation is still a separate question; the RSI pattern alone does not guarantee a decline.
For a bottom failure swing, mirror the sequence: RSI at 26, bounce to 38, higher low at 31, then break above 38. Exact numerical values are illustrative; the required logic is zone, reaction, failed retest and break. This ordering prevents an analyst from calling every reading below 30 a completed bullish pattern.
True Range and ATR: measure distance, not direction
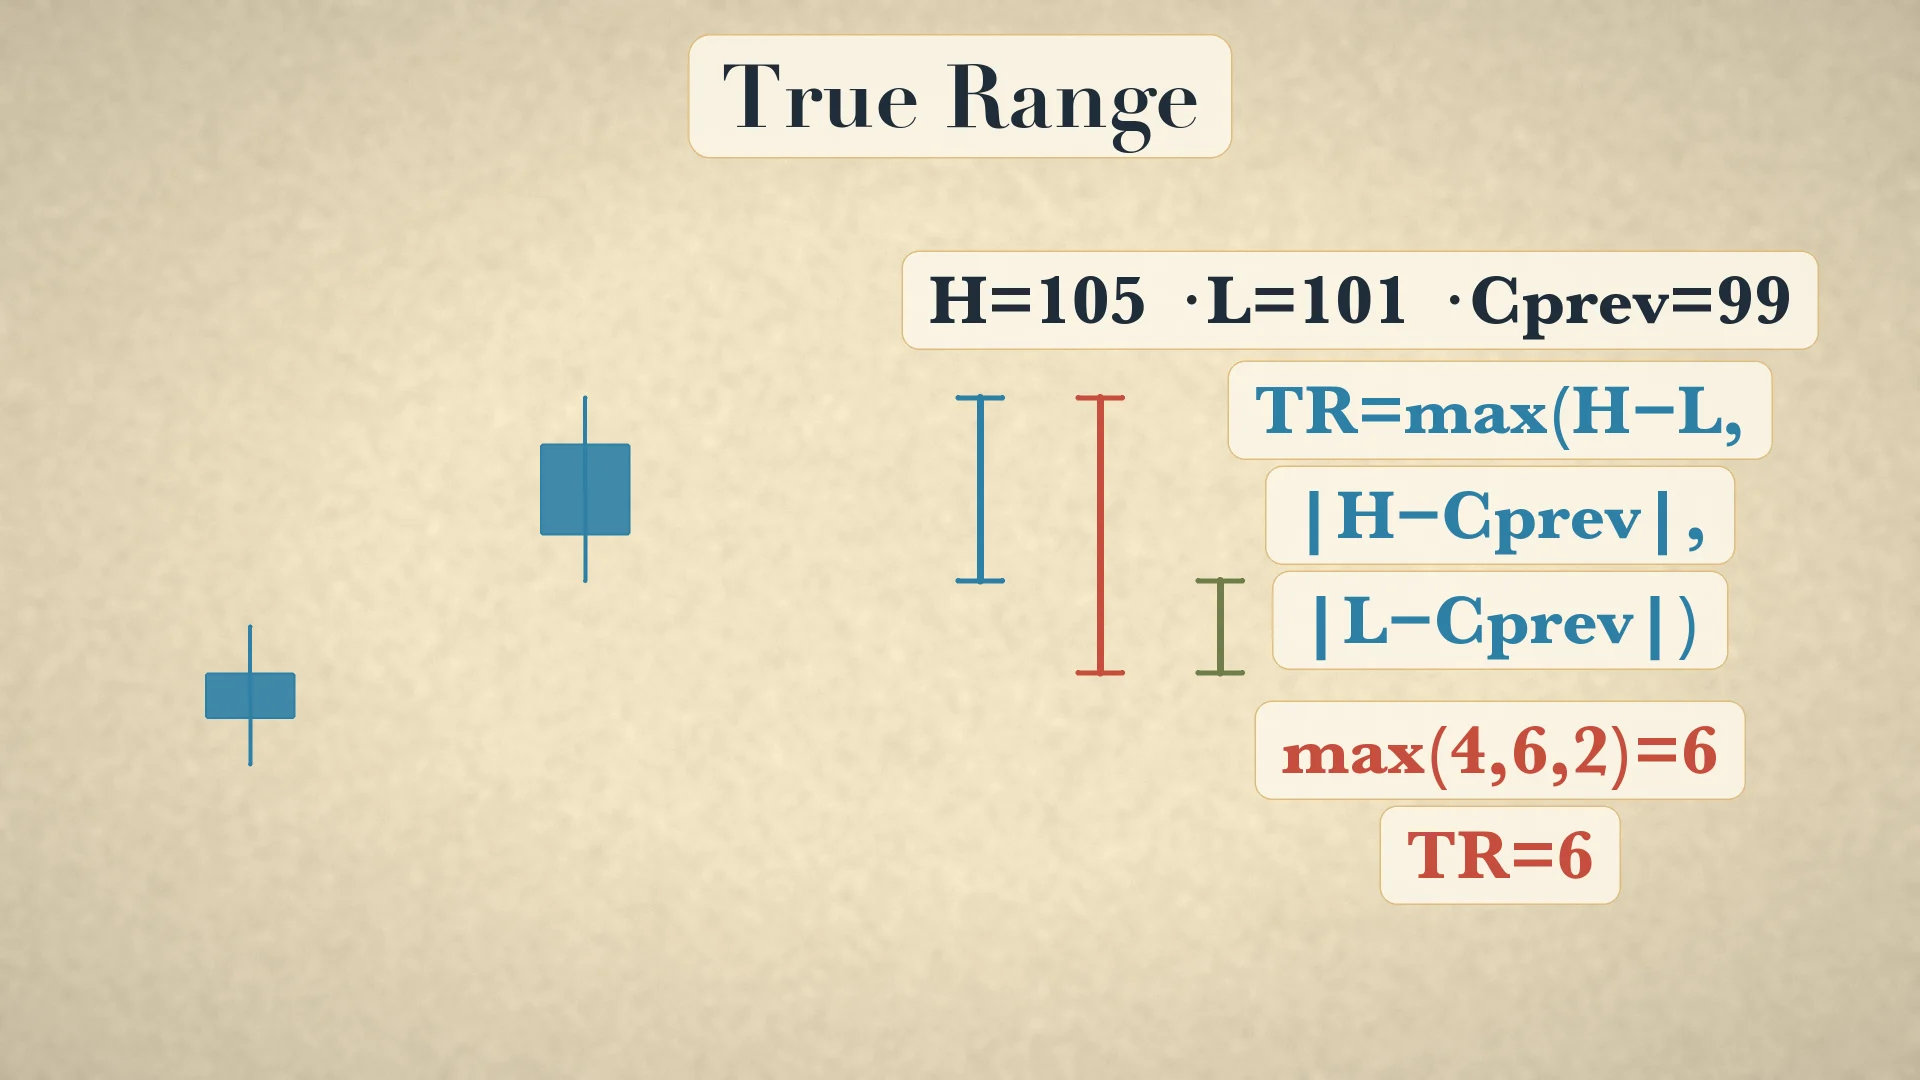
True Range includes gaps by comparing today's range with the previous close: TR=max(H−L, |H−C_prev|, |L−C_prev|). Suppose H=105, L=101, and C_prev=99. The three candidates are 4, 6, and 2; therefore TR=6. A simple high-minus-low calculation would miss the gap from 99 to 105. [5]
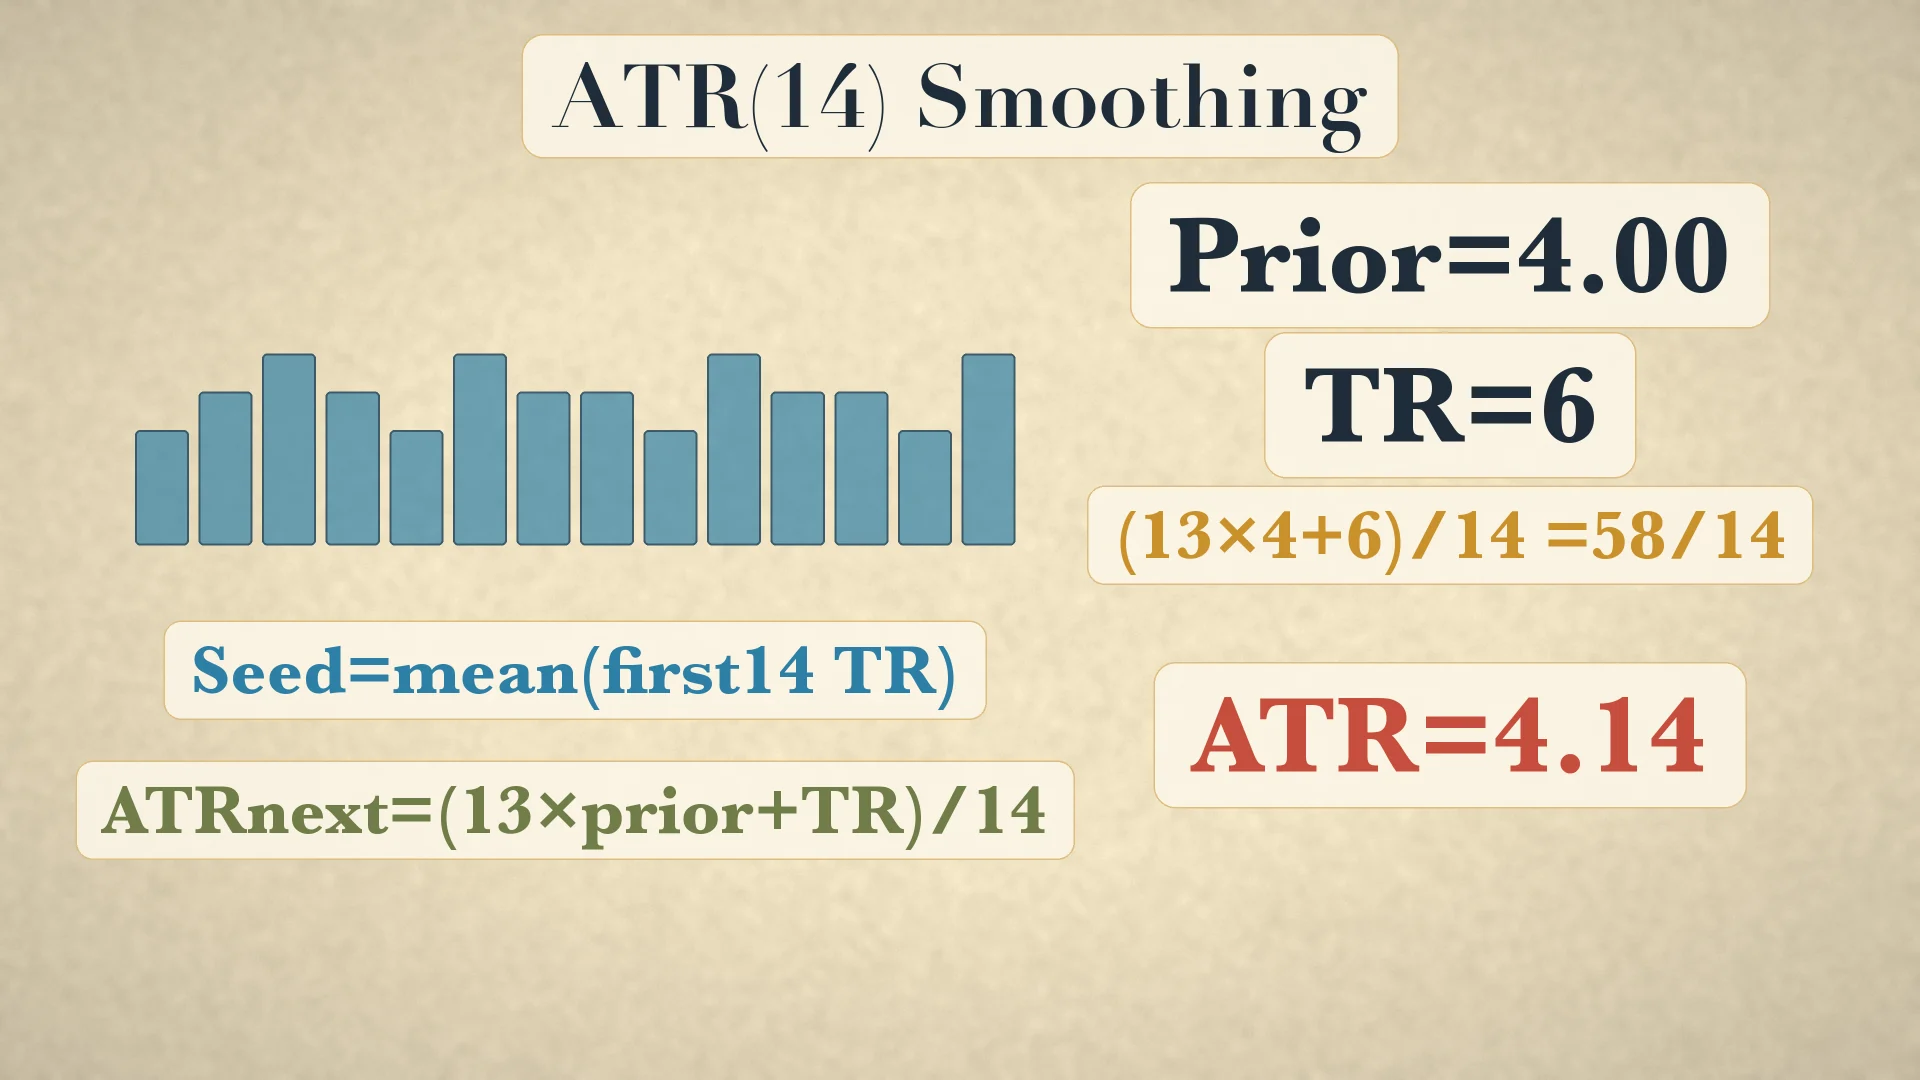
For ATR(14), seed with the mean of the first 14 True Range values. Then update with ATR_t=(13×ATR_(t−1)+TR_t)/14. If prior ATR is 4.00 and today's TR is 6.00, the numerator is 52+6=58, so new ATR is 58/14=4.142857, normally displayed as 4.14. Wilder's book also used a faster 7-day ATR in Volatility System examples, so 14 must not be described as the only original setting.
ATR says how far price has been moving, not where it will move. Rising ATR can accompany a rally, a selloff or violent two-way action. Falling ATR can accompany a quiet drift in either direction. Treating ATR as a direction signal is a category error.
Modern ATR distance and position-size example
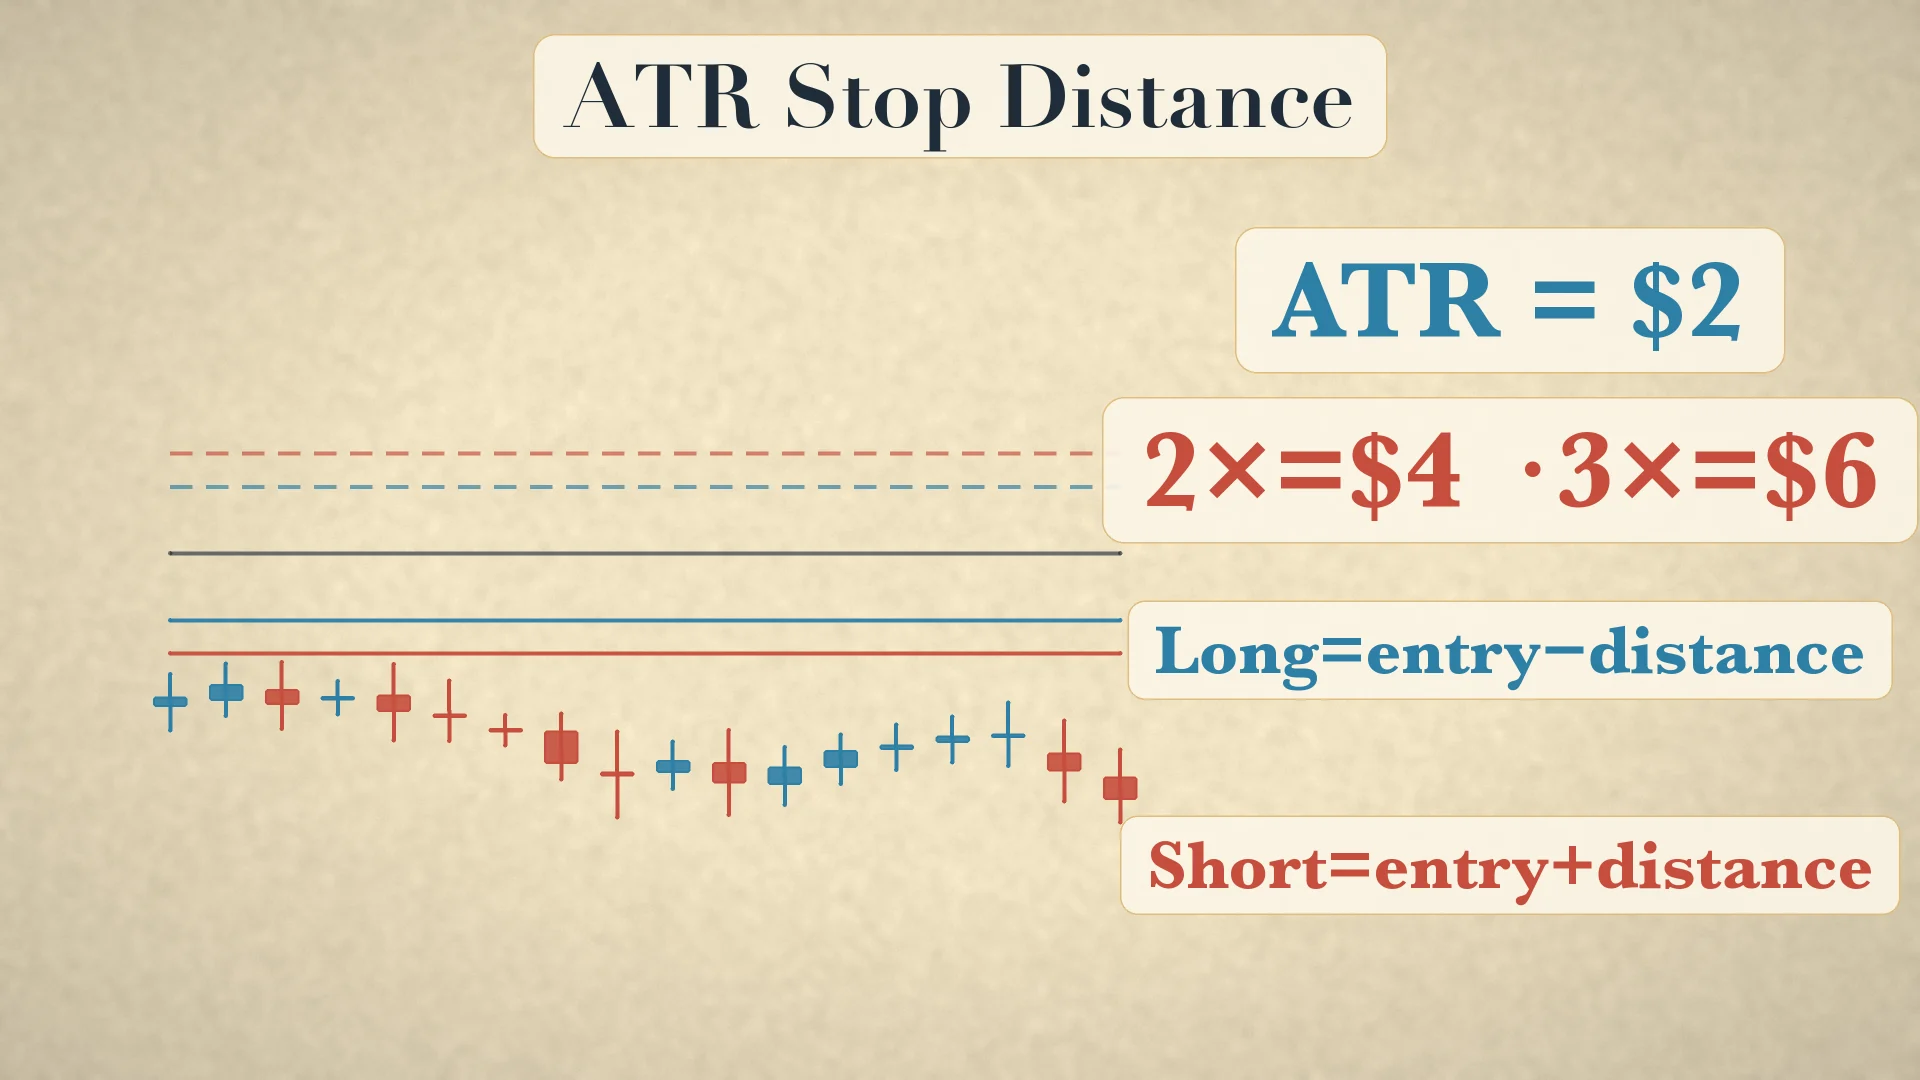
A modern educational use converts volatility into a predefined distance. Let stop distance = k×ATR. If ATR is $2 and k=2, distance is $4 per share; with k=3, it is $6. For a long example at $50, those reference stops are $46 or $44. For a short example at $50, they are $54 or $56. This is not an original Wilder entry rule and it cannot contain a gap. [5]
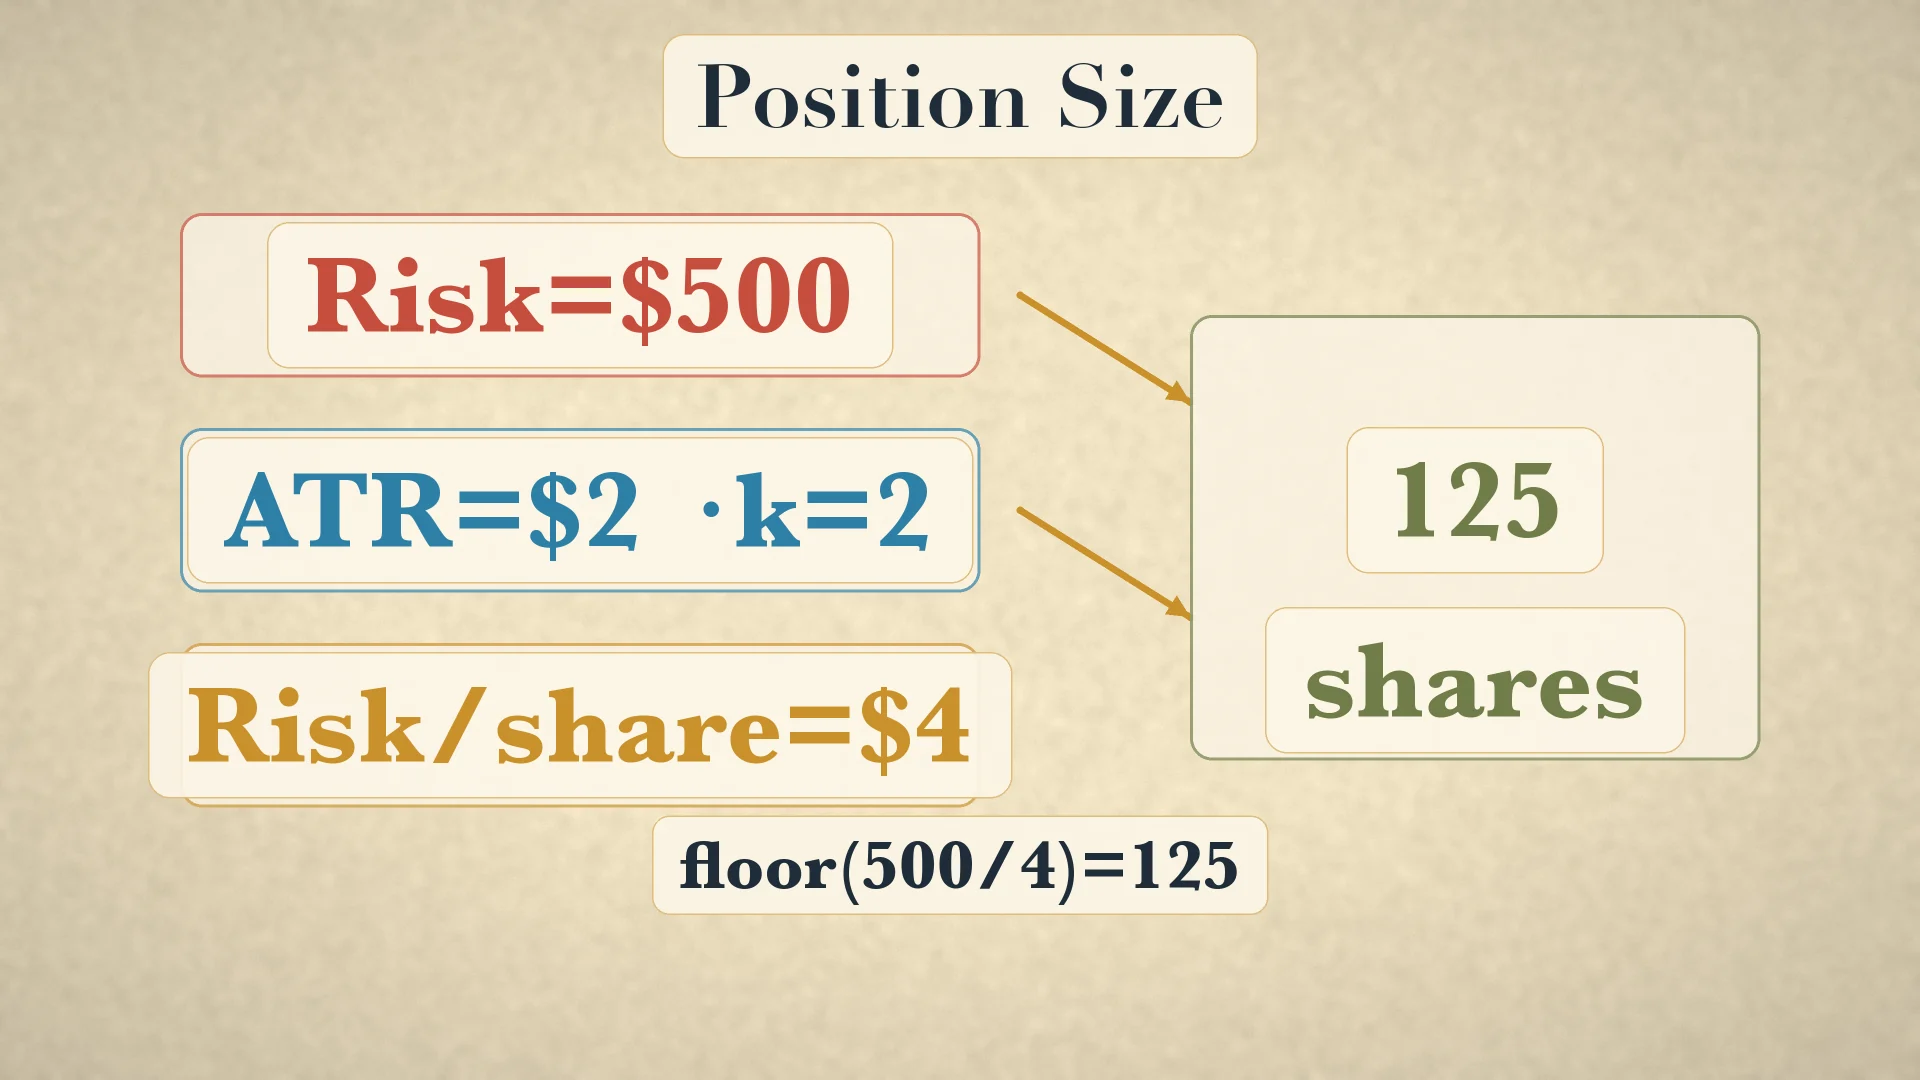
Worked cash-risk sizing
- Choose a cash risk budget before the entry:
$500. - Read ATR from the already closed bar:
$2. - Choose the educational multiplier:
k=2. - Risk per share is
2×$2=$4. - Position size is
floor($500/$4)=125 sharesbefore commissions, slippage and gaps. - At
k=3, risk per share becomes $6 and size becomesfloor(500/6)=83 shares; wider distance means smaller size.
The example normalizes planned price risk; it does not make 125 shares safe. A gap can jump past the stop, costs consume part of the budget, and ATR can change after entry. The useful discipline is that size follows distance and budget, rather than being chosen first.
DMI and ADX: direction and strength are different fields
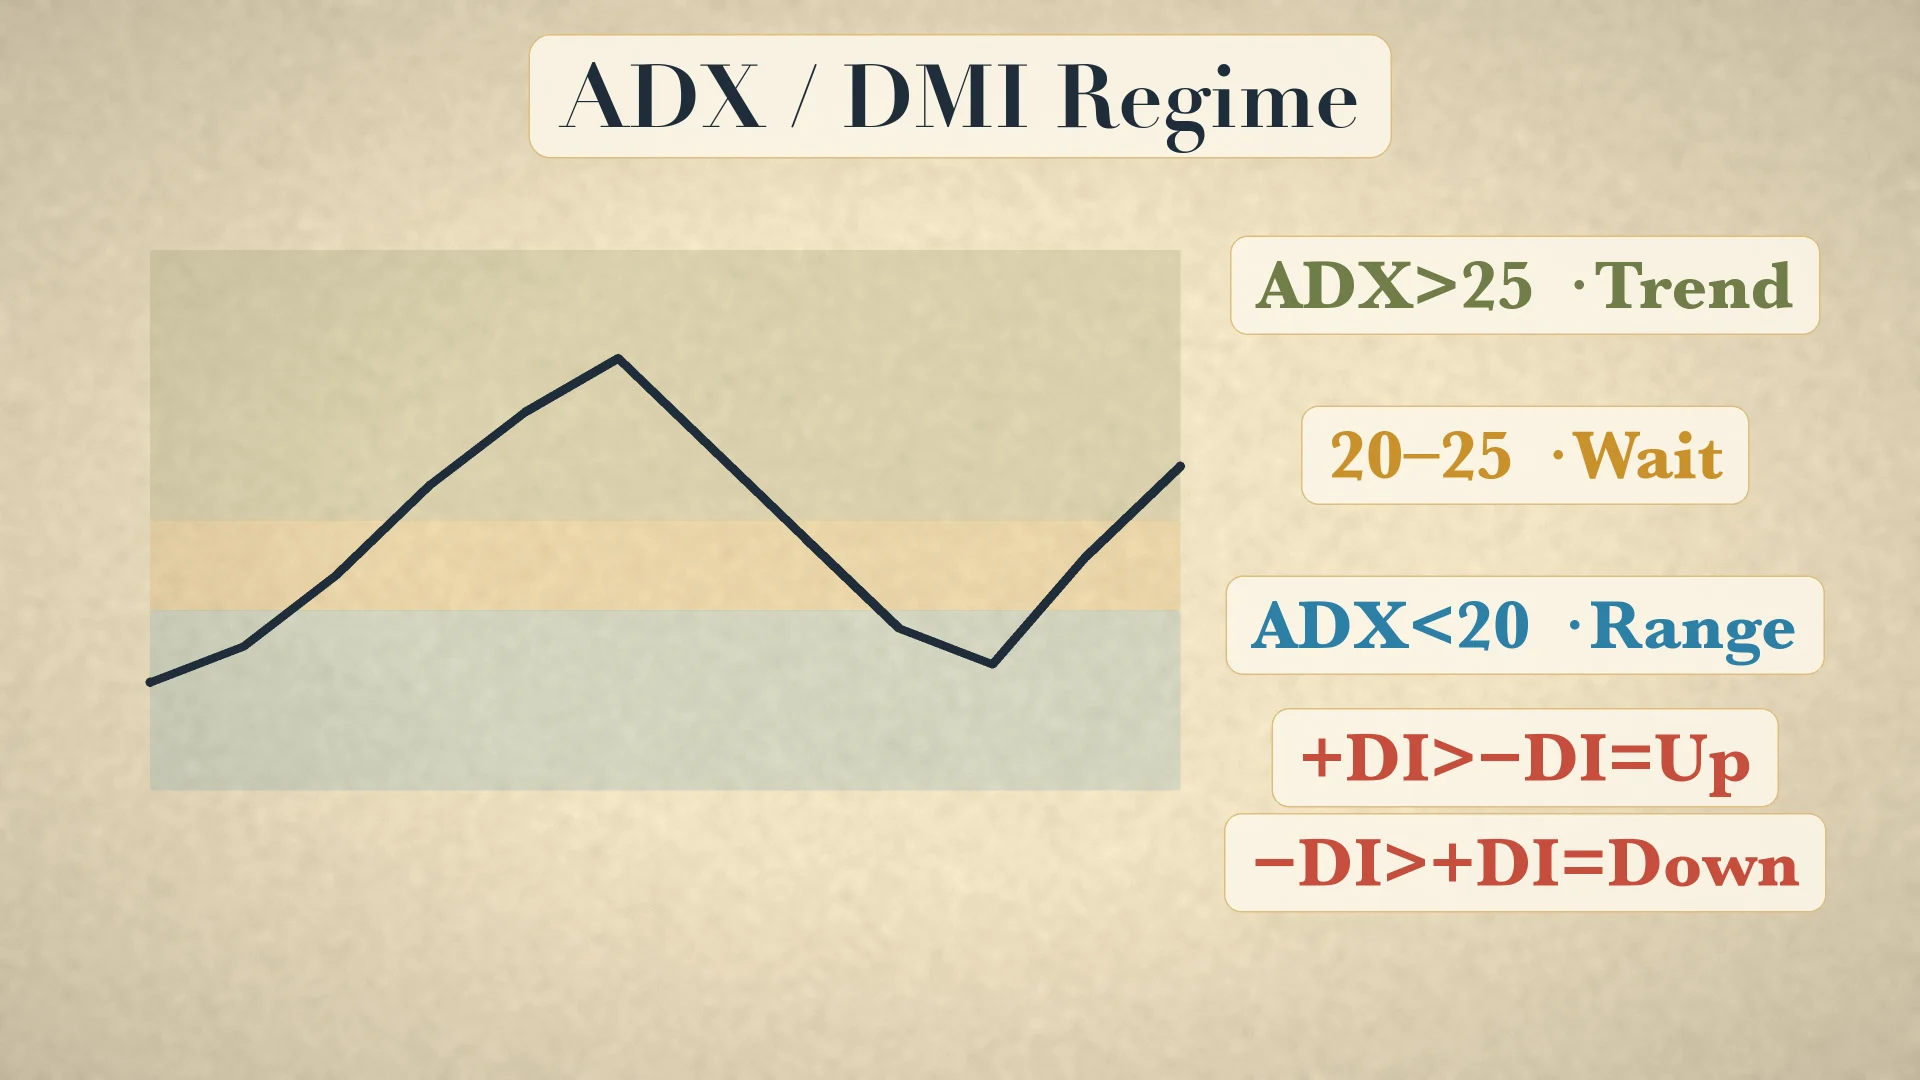
Wilder's Directional Movement framework uses 14-period smoothing. +DI and −DI carry the directional comparison: +DI>−DI aligns with positive directional dominance, while −DI>+DI aligns with negative dominance. ADX smooths the strength of that directional separation. ADX itself is non-directional: an ADX reading of 35 can describe a strong rise or a strong decline. [1][6]
A common chart-reading convention treats ADX above 25 as trending, below 20 as weak or ranging, and 20–25 as an undecided band. These are working bands, not guaranteed switches. Example: ADX 28 with +DI 31 and −DI 17 describes strength with positive directional dominance. ADX 28 with +DI 16 and −DI 30 describes similarly strong negative dominance. ADX 17 says the directional movement is weak under this convention, regardless of which DI is slightly higher.
Parabolic SAR: an accelerating trailing calculation
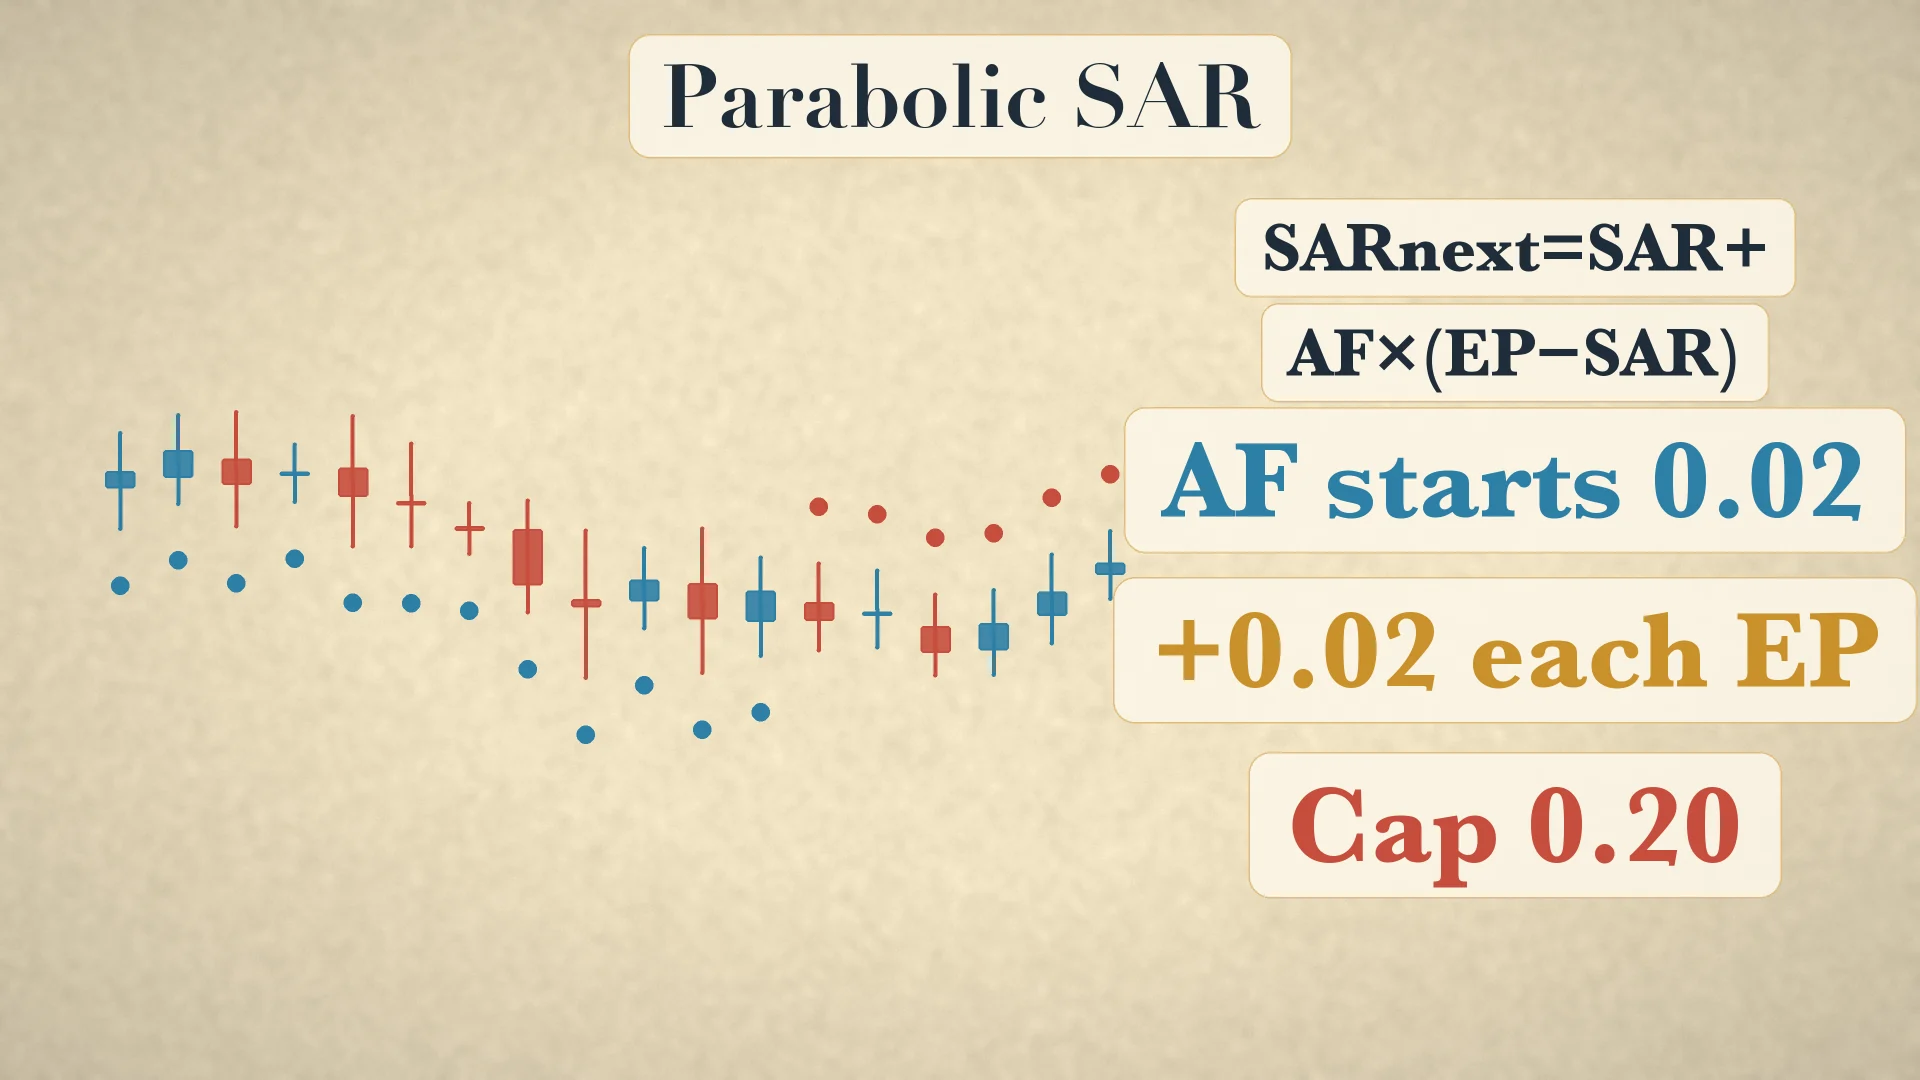
Parabolic SAR uses SAR_next = SAR + AF×(EP−SAR). EP is the most favorable extreme reached since the current trend began. The acceleration factor starts at 0.02, rises by 0.02 when a new EP is made, and caps at 0.20. Dots below bars correspond to a long trailing stop; dots above bars correspond to a short trailing stop. [7]
Worked SAR update
- Assume a long trend with current
SAR=96, extreme pointEP=105, andAF=0.04. - Distance to the extreme is
105−96=9. - Acceleration contribution is
0.04×9=0.36. - Next SAR is
96+0.36=96.36before the method's bar constraints. - If a new EP is made, AF rises to 0.06 for the following update, never beyond 0.20.
The increasing AF makes SAR catch up as a move extends. That is useful in trends and hazardous in ranges, where repeated flips can create whipsaws. SAR is a stop-and-reverse system, not proof that the new direction will persist.
Combine the tools on a chart without double-counting
An educational workflow assigns one question to each tool. First use price structure and +DI/−DI for directional context. Second use ADX to decide whether trend-following study is permitted under the chosen 20/25 convention. Third use RSI to inspect momentum, failure swings or divergence without automatically fading an extreme. Fourth use ATR to translate current movement size into a stop distance and position-size calculation. Fifth use SAR only as a trailing mechanism when the environment is already treated as trending.
Example: price structure is rising, +DI is above −DI, ADX is 29, RSI is 68, ATR is $2, and SAR dots are below price. Nothing here predicts the next bar. Under a predefined educational plan, the first three observations allow a long-trend setup to be studied; ATR defines the distance and size; SAR supplies a trailing reference. If ADX falls to 17 and price becomes sideways, the same plan can disable SAR entries rather than accept repeated flips.
Common mistakes are selling solely because RSI exceeds 70, using ATR as a directional forecast, reading ADX above 25 as bullish, treating 20/25 as natural laws, calling the 125-share example Wilder's original entry rule, and using SAR in a range without acknowledging whipsaw. None of the four predicts the future. RSI can stay extreme, ATR is directionless, ADX lags, SAR can flip repeatedly, and all calculations depend on clean input data and exact implementation.
Record the bar timestamp and input convention for every value. An RSI computed from closes, an ATR computed from a different session, and a SAR taken from a platform with different bar boundaries do not form one coherent test. Recalculate from the same price series when possible. If two platforms disagree, inspect the seed and smoothing rather than choosing the value that supports the preferred story.
Teaching diagrams
Glossary
- RSI
- A 0–100 momentum oscillator built from average gains and losses.
- True Range
- The largest of the session range and two gap-aware ranges.
- ATR
- A smoothed average of True Range; volatility without direction.
- ADX
- Smoothed directional-movement strength; it does not state up or down.
- +DI / −DI
- Directional Movement lines used to compare up and down direction.
- Parabolic SAR
- A trend-following stop-and-reverse level using AF and EP.
Frequently asked questions
Does RSI above 70 automatically mean sell?
No. RSI can remain above 70 during a strong trend; treat it as context.
Does ATR say price direction?
No. ATR measures volatility only.
What does ADX measure?
Trend strength. +DI and −DI carry directional information.
Is the 125-share ATR example Wilder's entry rule?
No. It is a modern risk-sizing example, not an original Wilder entry rule.
Sources
- CMT Association interview with J. Welles Wilder Jr. — cmtassociation.org
- J. Welles Wilder Jr. obituary — www.dignitymemorial.com
- WorldCat: New Concepts in Technical Trading Systems — search.worldcat.org
- Fidelity: Relative Strength Index — www.fidelity.com
- Fidelity: Average True Range — www.fidelity.com
- Fidelity: Average Directional Index — www.fidelity.com
- Fidelity: Parabolic SAR — www.fidelity.com
Educational content only — not financial advice or a promise of performance.