
The 1983–84 teaching experiment
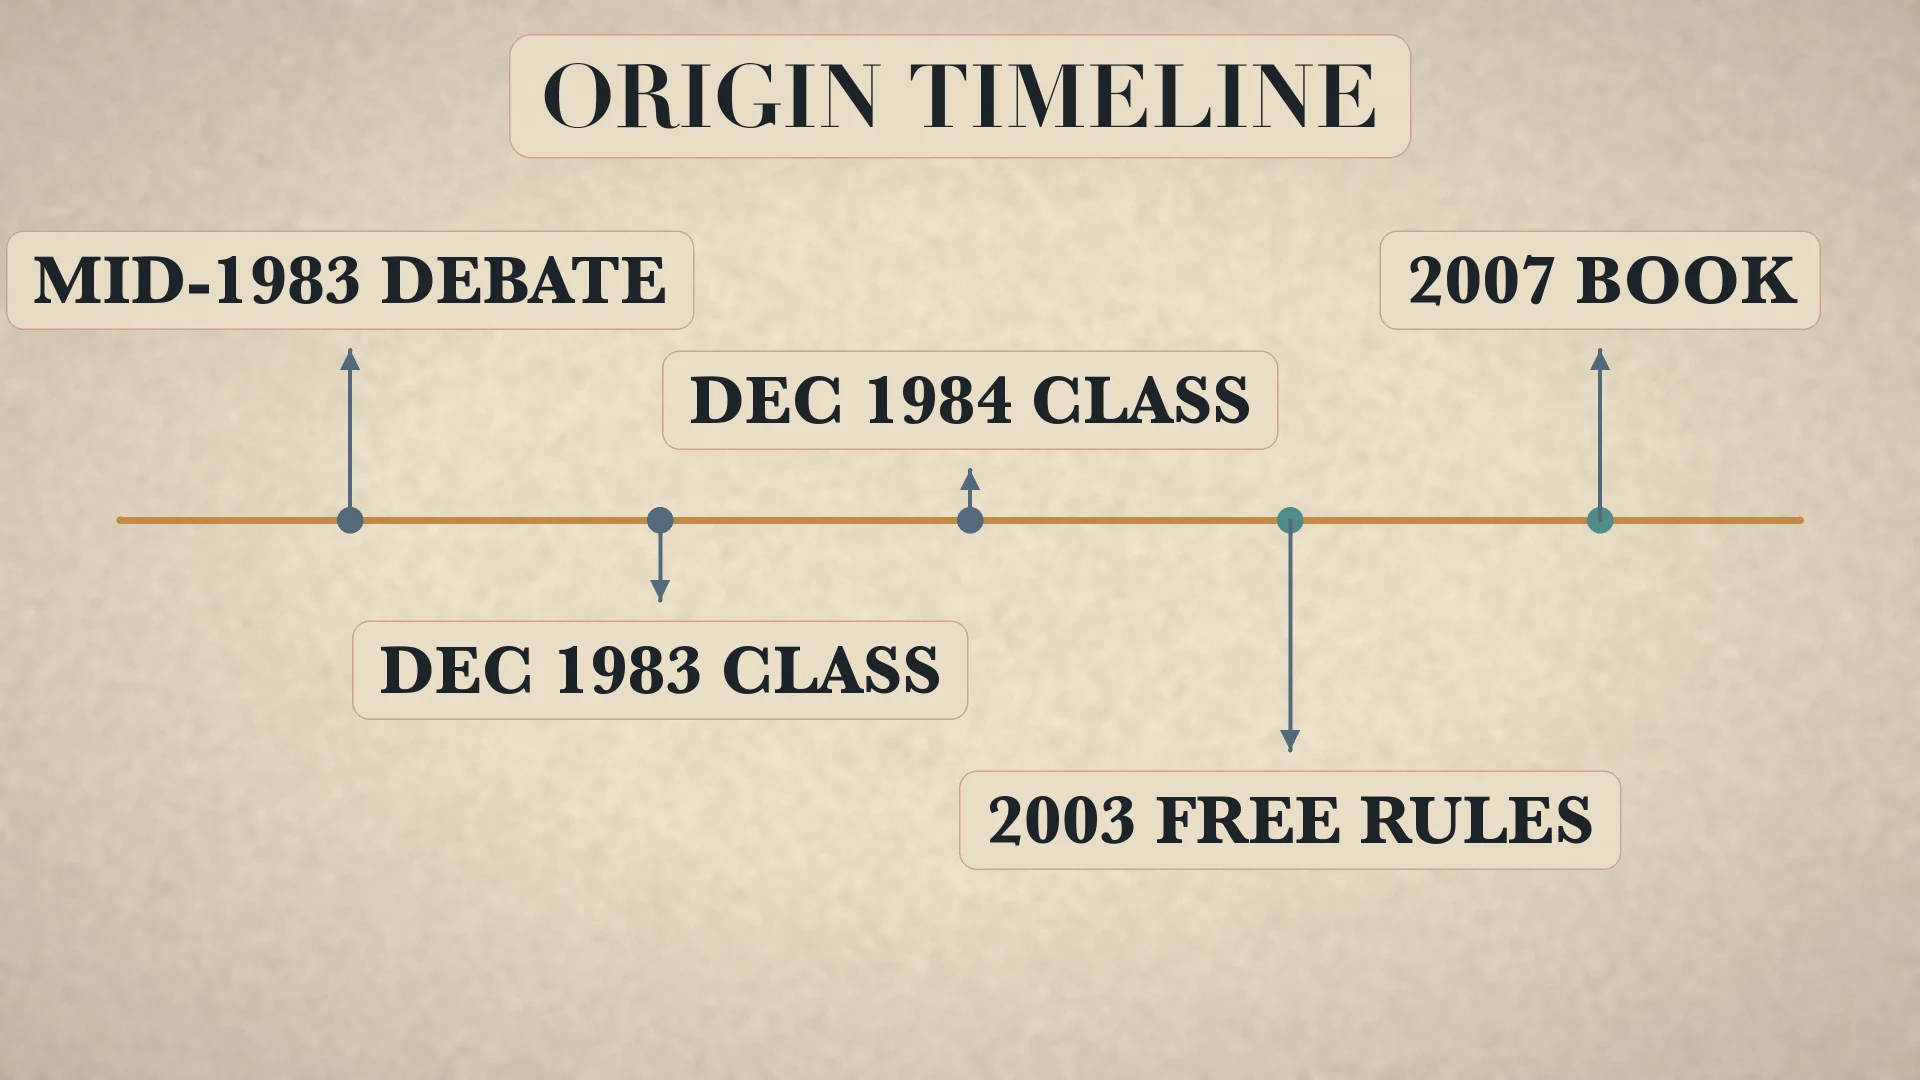
In mid-1983, Chicago commodity trader Richard Dennis and his long-time friend and trading partner William “Bill” Eckhardt debated whether successful traders were born with unusual aptitude or could be trained. Dennis proposed a real-account experiment. The sources document a debate and experiment, not a cash wager, so the popular story should not be inflated into a bet with invented terms. [1][3]
Dennis advertised for apprentices in The Wall Street Journal, Barron's and The New York Times in late 1983 and again in 1984. About 1,000 people answered each advertisement; 23 recruits were selected across two cohorts. The first group trained in Chicago for roughly two weeks at the end of December 1983 and began trading in early 1984. The second trained in December 1984 and began in 1985. That is why training-year and trading-year labels sometimes differ. [1]
Dennis later recalled returning from Asia and saying traders could be grown like turtles in Singapore. The 1989 Wall Street Journal article reports this recollection; it is not contemporaneous proof of a particular turtle-farm visit. Curtis Faith, a 19-year-old recruit, later signed the free Original Turtle Trading Rules, published through OriginalTurtles.org in 2003, and published Way of the Turtle with McGraw-Hill in 2007. [1][2][4]
Two breakout entry systems
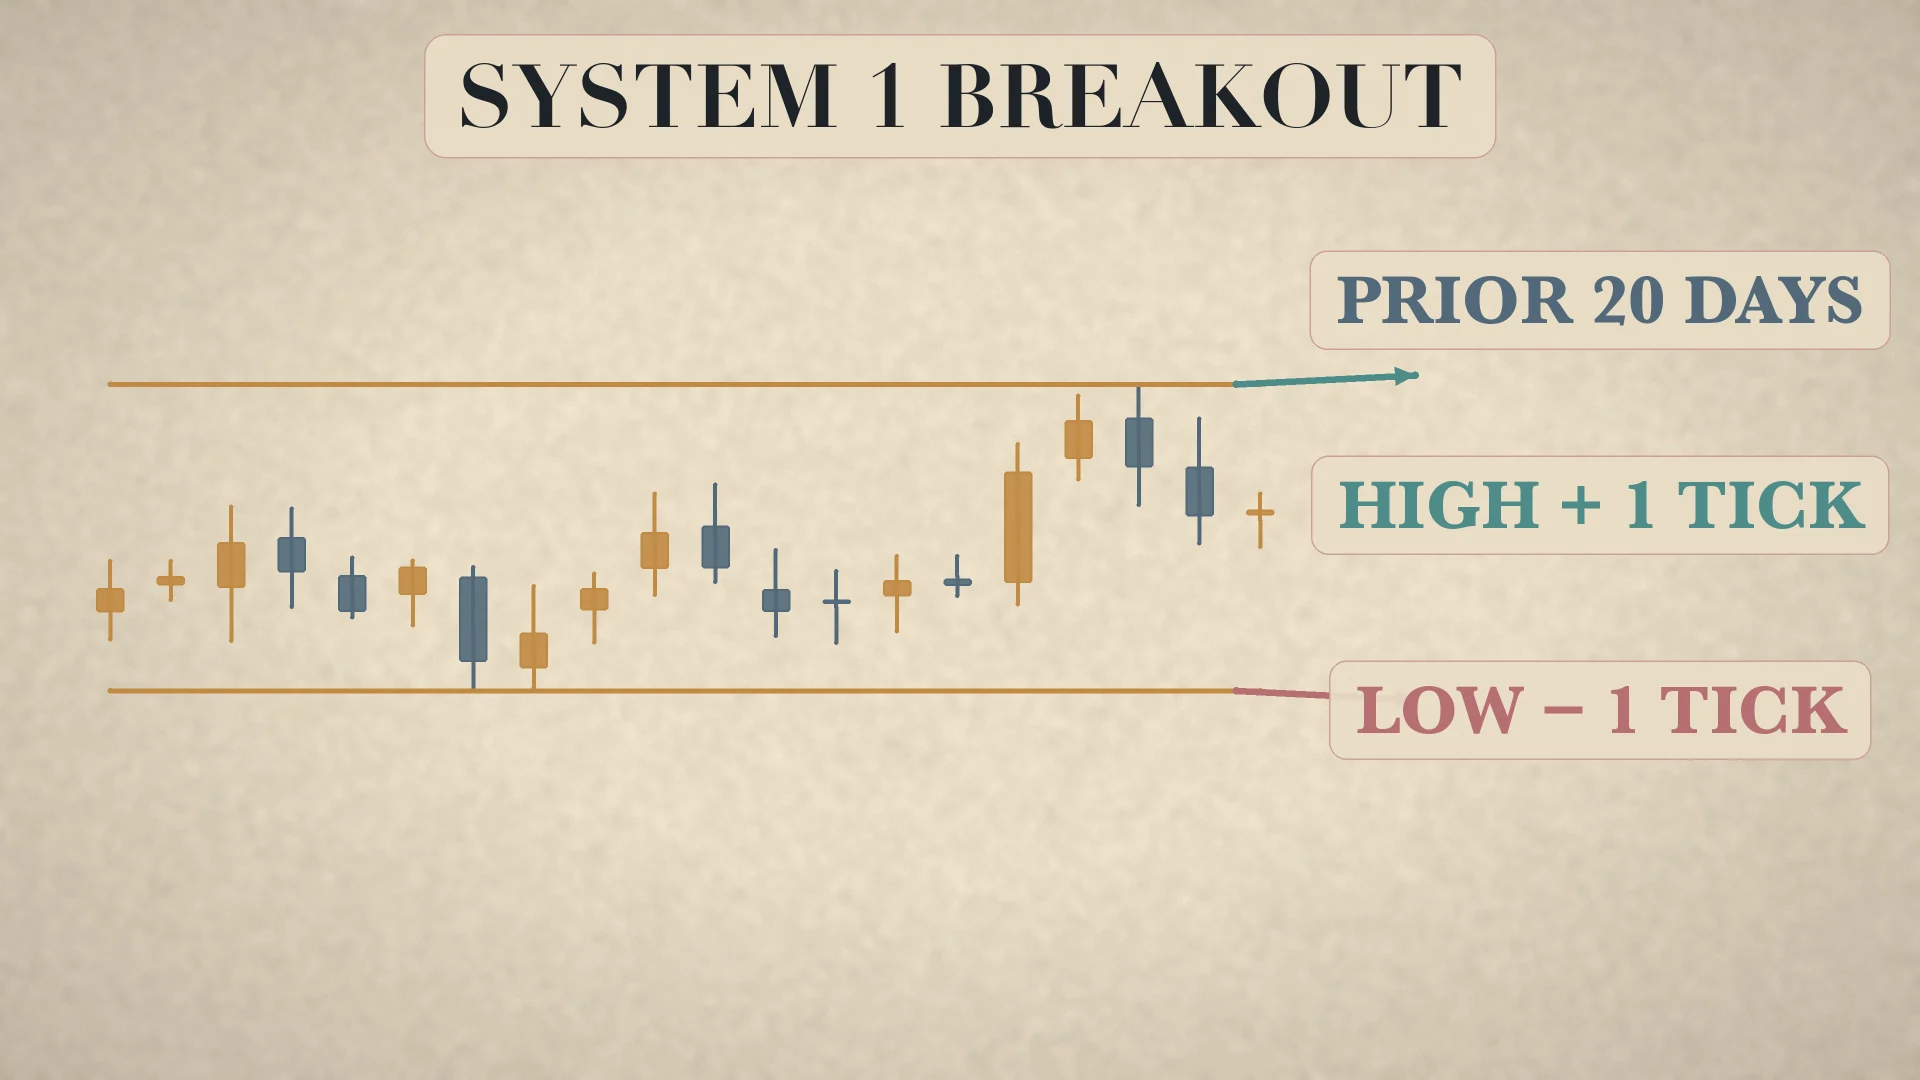
The original program traded liquid U.S.-exchange futures. A breakout means price exceeds the high or low of the preceding lookback; merely touching the boundary is not enough. The Turtles acted intraday as the level was exceeded and accounted for gaps through the level by entering at the open. The rules therefore describe executable threshold logic, not a close-only channel picture. [2]
System 1: filtered 20-day breakout
- Find the highest high and lowest low of the preceding 20 days; do not include the current day.
- Buy one Unit one tick above the 20-day high or sell one Unit one tick below the 20-day low.
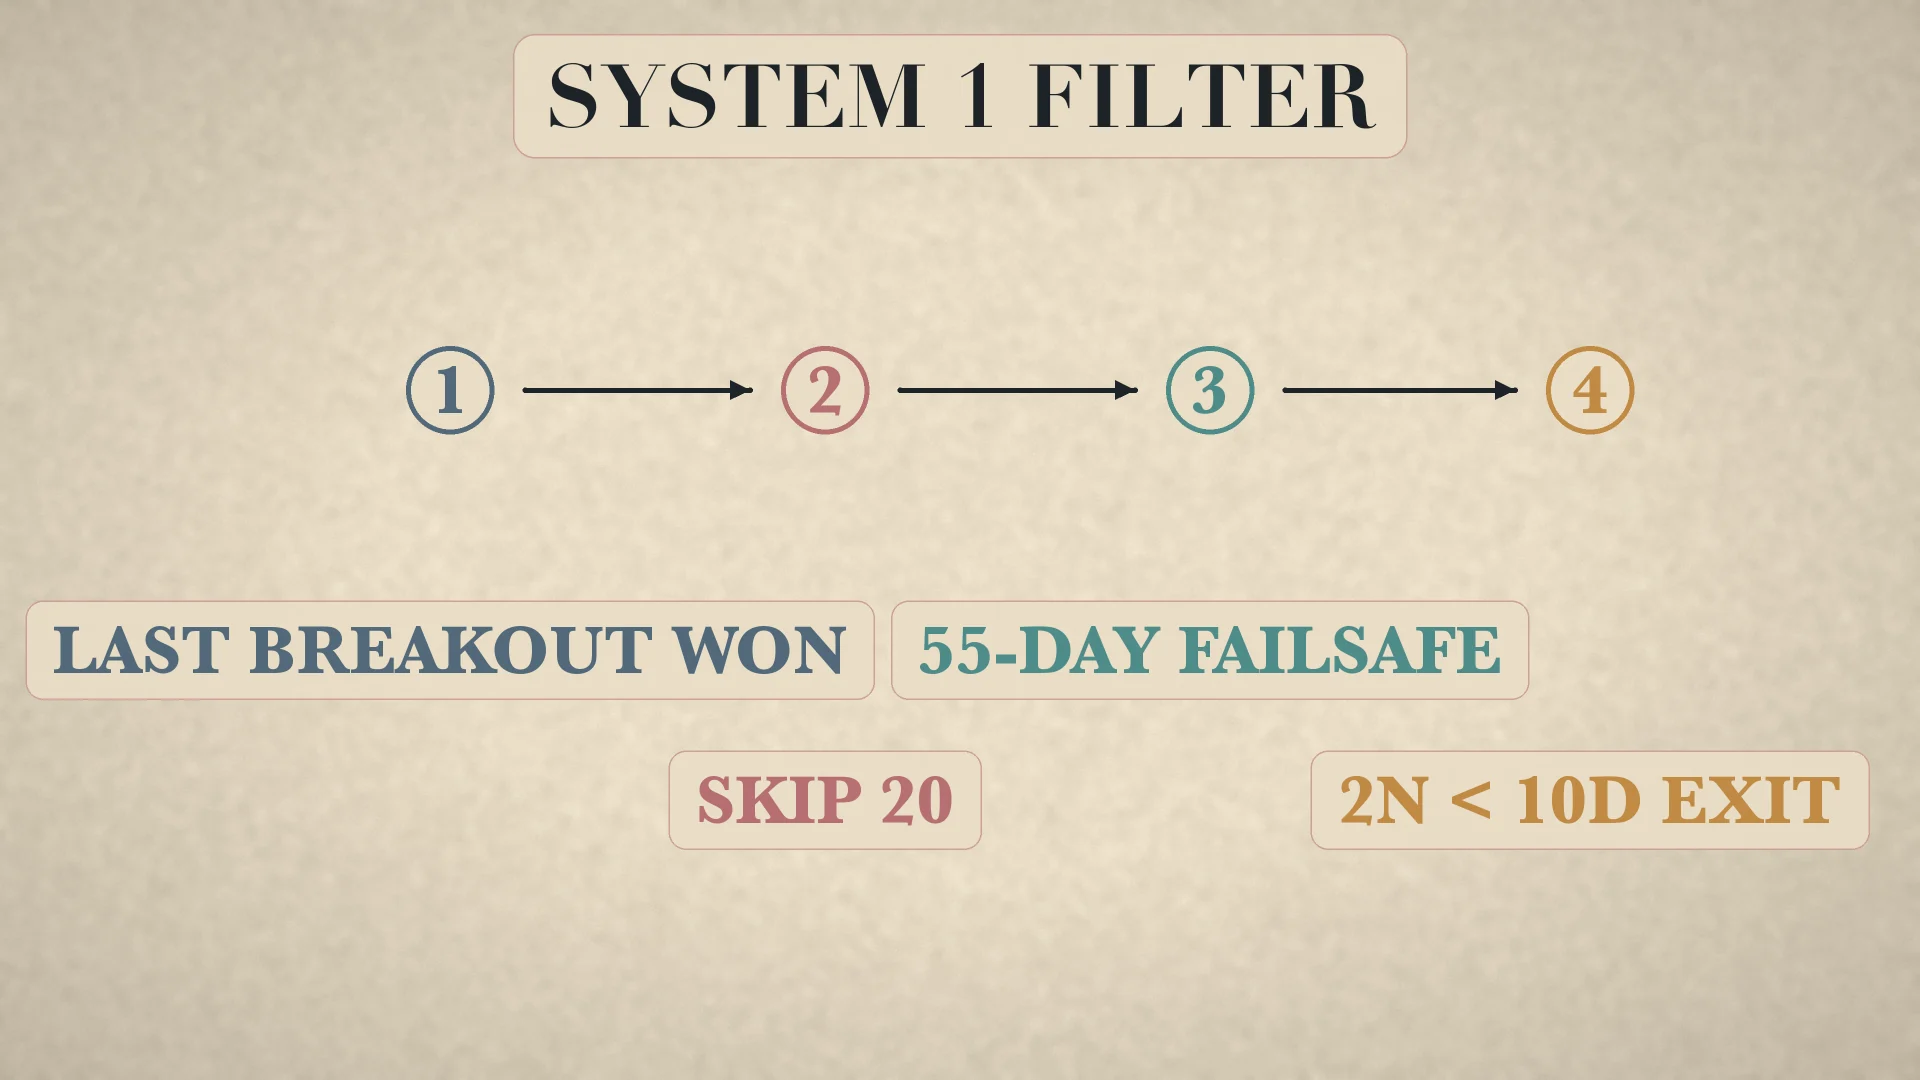
- Check the previous breakout in that market. If it would have been a winner, skip this 20-day signal.
- A previous breakout counted as losing if price moved 2N against it before a profitable 10-day exit.
- If the 20-day signal is skipped, use the 55-day breakout as a failsafe so a major move is not automatically missed.
System 2: unfiltered 55-day breakout
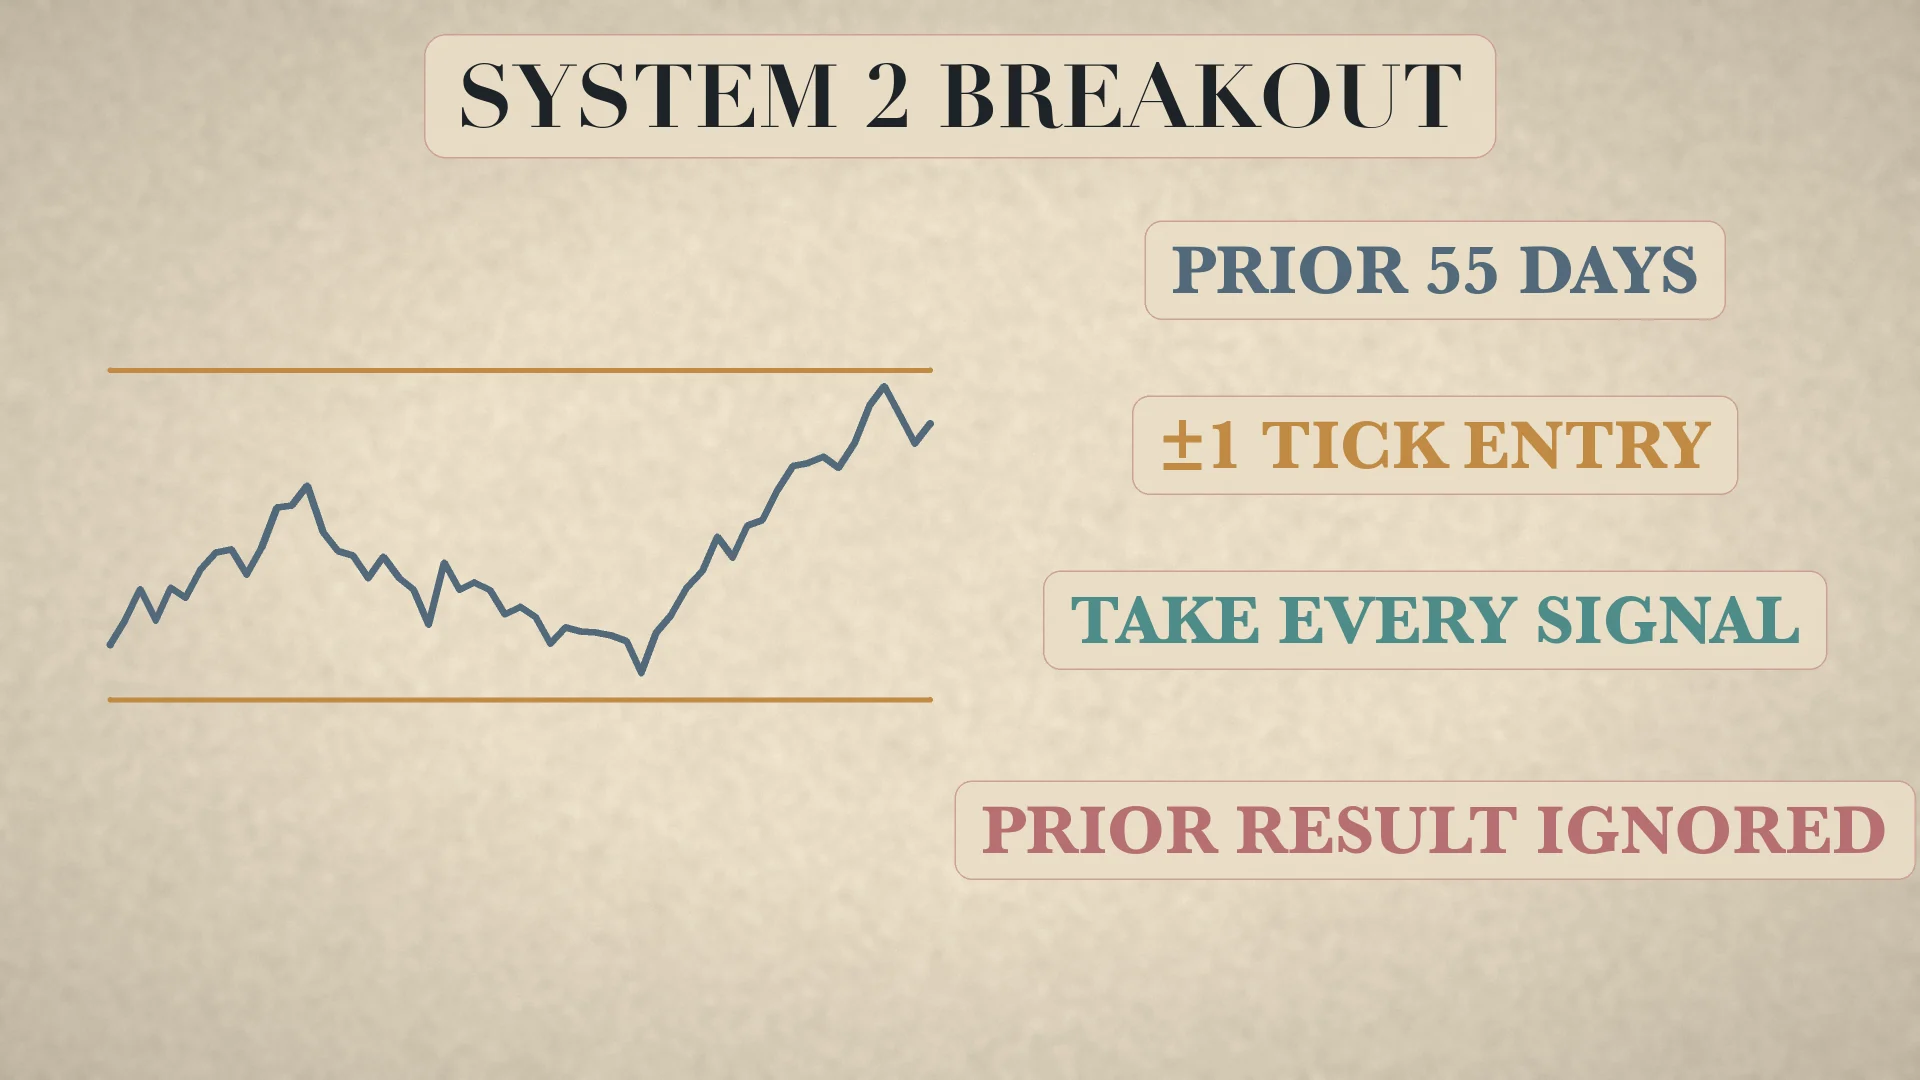
System 2 buys one Unit one tick above the preceding 55-day high or sells one Unit one tick below the preceding 55-day low. It takes every signal regardless of whether the previous breakout won or lost. The distinction is simple but essential: System 1 is 20-day and filtered with a 55-day failsafe; System 2 is 55-day and unfiltered.
Worked entry example: the prior 20-day high is 72.40 and the contract tick is 0.01. The System 1 long threshold is 72.41. A trade at 72.40 is not a breakout; 72.41 is. If the previous breakout would have won, that signal is skipped and the trader watches the 55-day threshold instead. This example demonstrates rule order, not whether a current contract should be bought.
True Range and N: the volatility engine
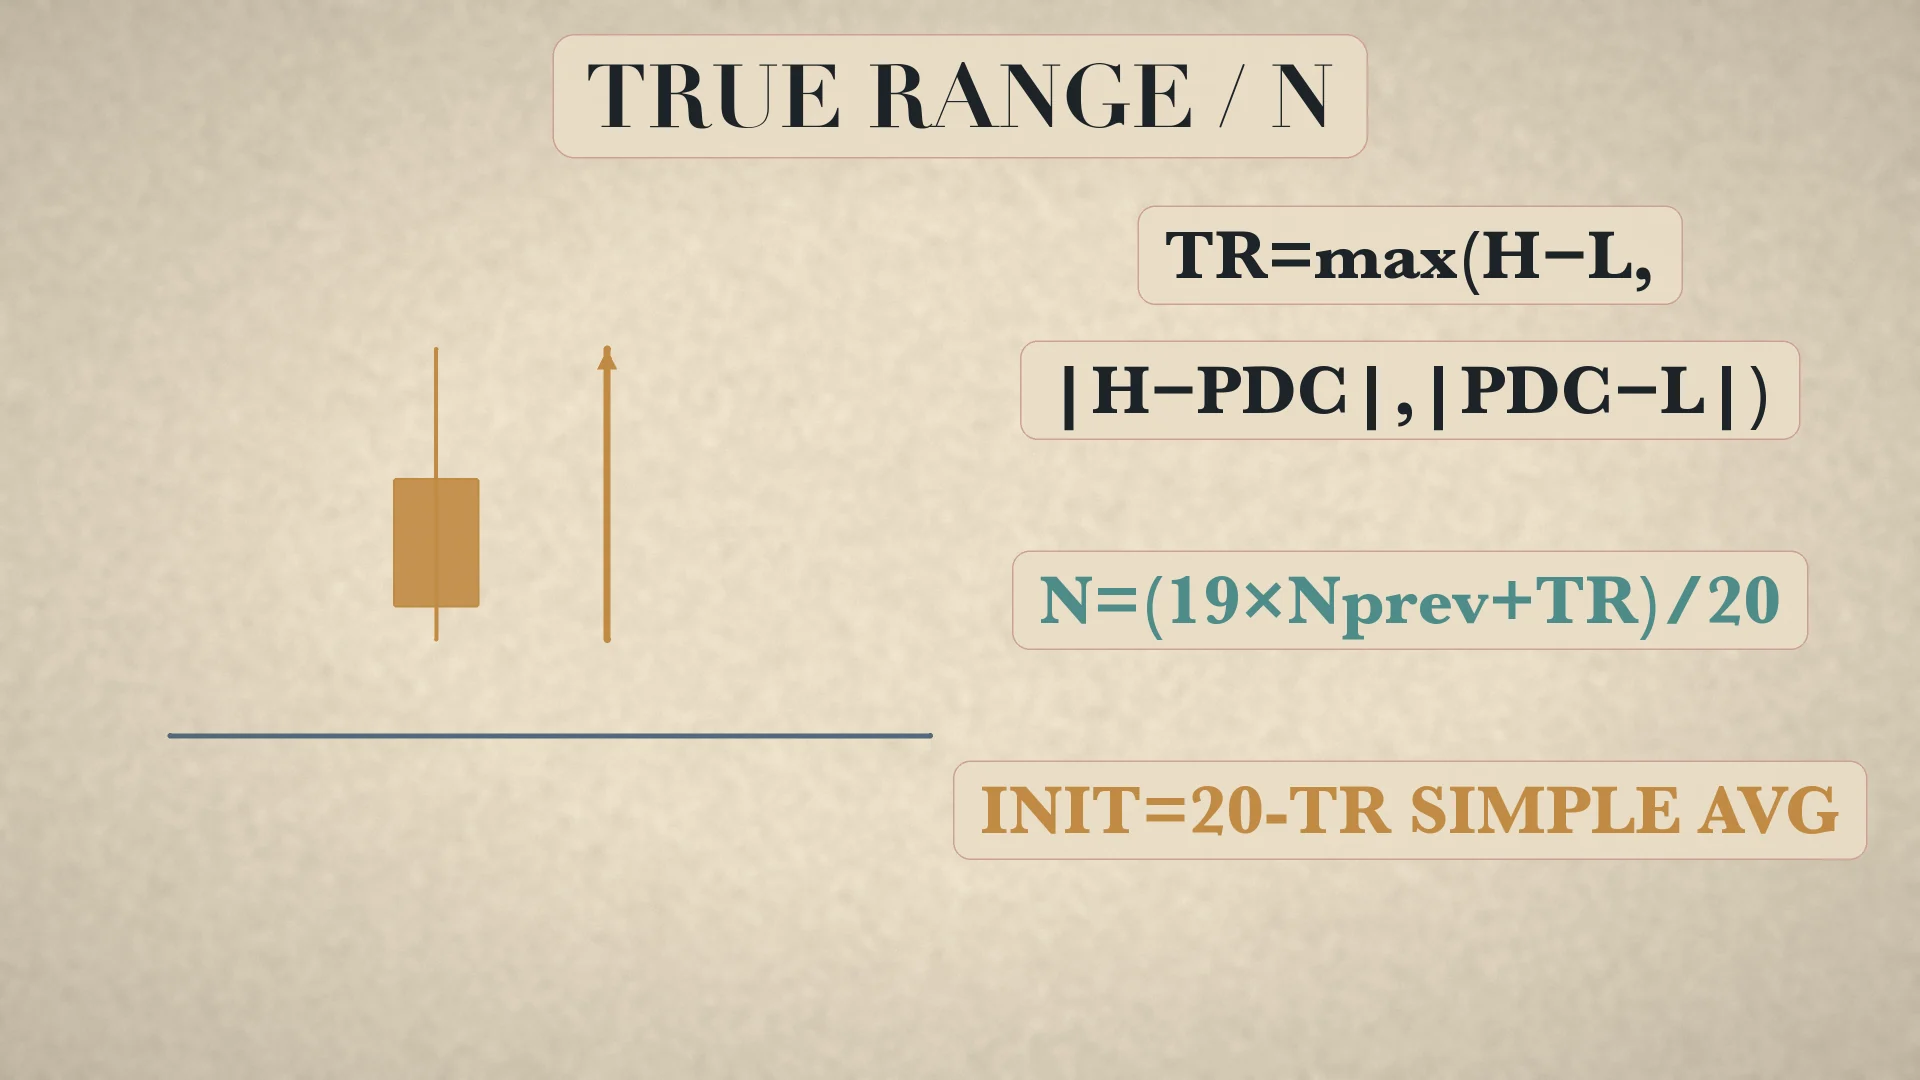
The system normalizes markets with N, a 20-day smoothed True Range. First calculate TR=max(H−L,|H−previous close|,|previous close−L|). Initialize N with the simple average of the first 20 TR values. Thereafter update N_today=(19×N_previous+TR_today)/20. This is Wilder-style 1/20 smoothing; do not substitute a generic EMA using 2/(20+1). [2]
Worked N update
- Suppose the 20-TR seed totals 30.00 points; initial
N=30/20=1.50. - On the next day, high is 81, low is 78, and previous close is 77.
- The TR candidates are
3,4, and1, soTR=4. - Update N:
(19×1.50+4)/20=(28.50+4)/20=1.625. - Use 1.625 in the next unit-size, stop and addition calculations, subject to contract rounding.
N is not a directional forecast. It is a common volatility yardstick. A higher N widens the price distance represented by one risk unit and normally reduces contract count; a lower N narrows the distance and normally increases count. That relationship allows unlike futures markets to be compared in dollar-volatility terms.
Dollar volatility and one Unit
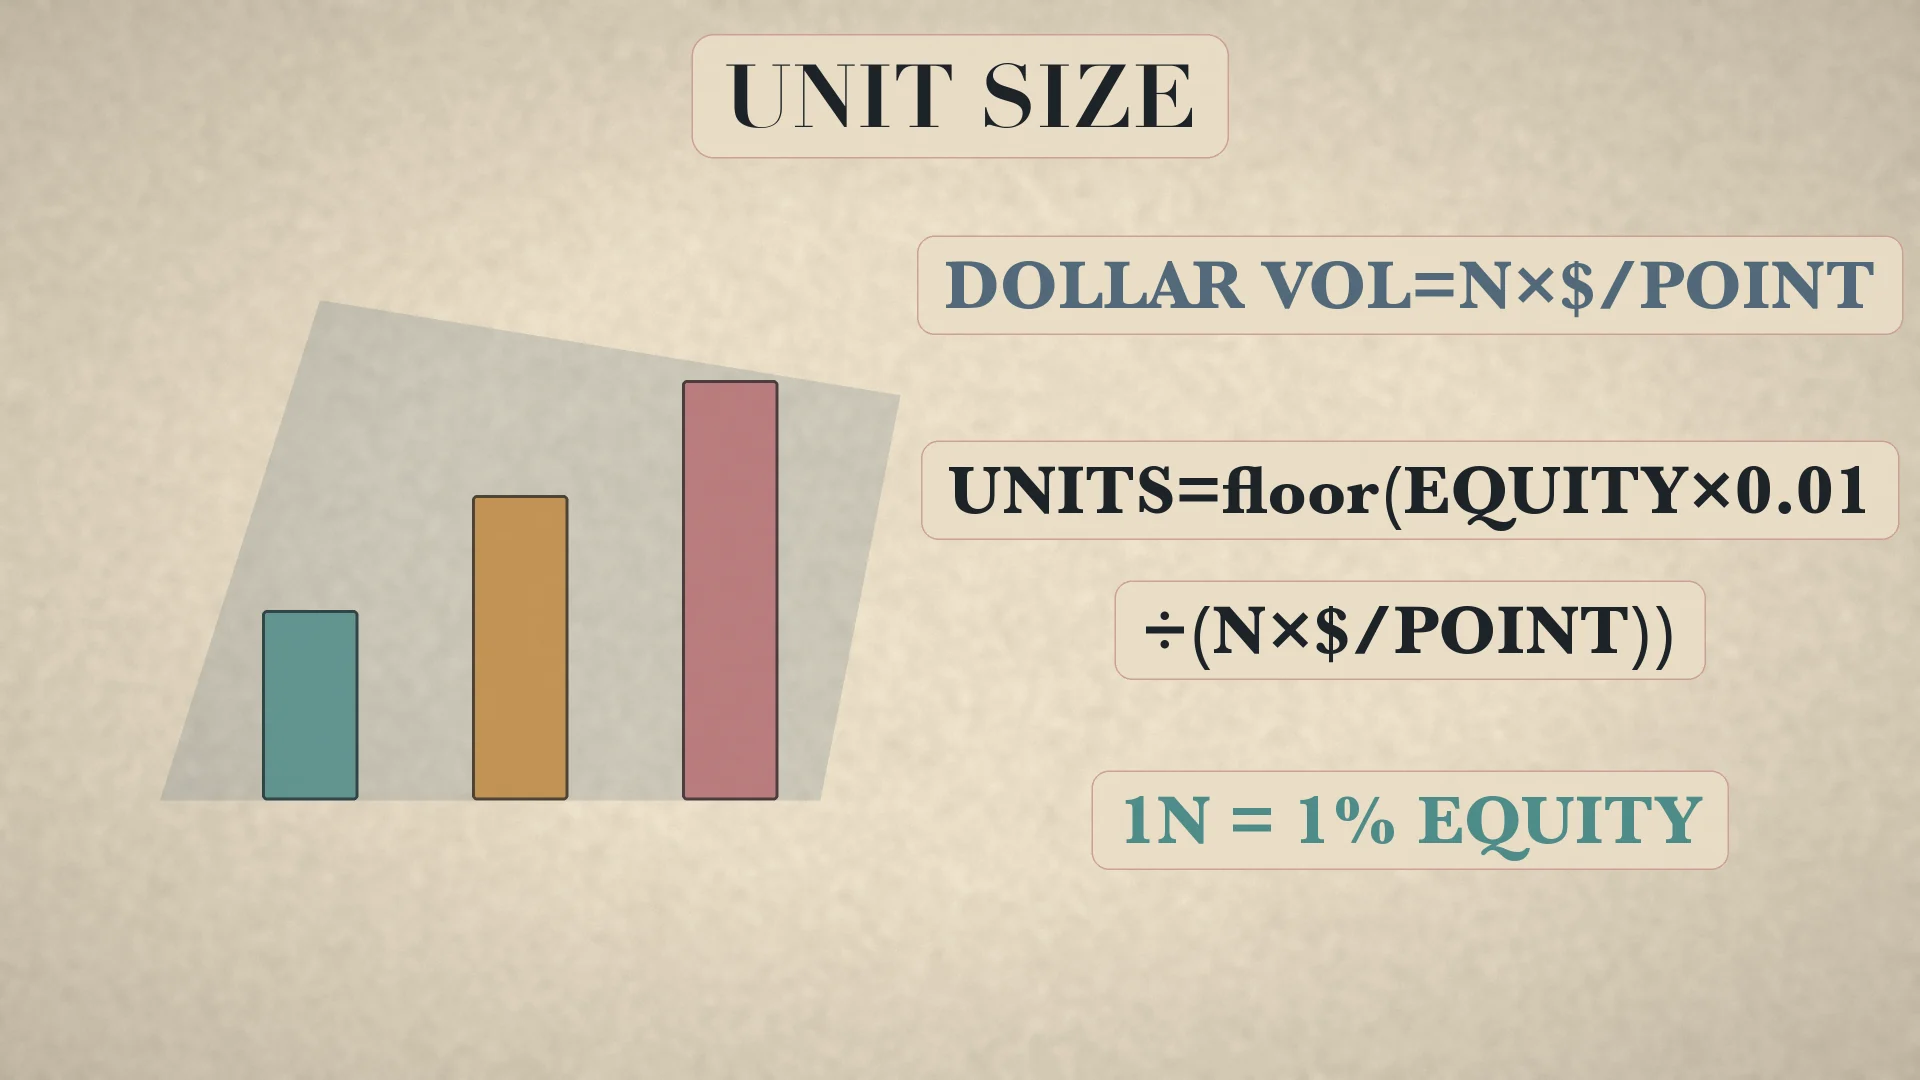
Convert N into money: dollar volatility = N×dollars per point. The original Unit was sized so a 1N move equaled 1% of account equity: contracts=floor((equity×0.01)/(N×dollars per point)). Fractional contracts are truncated. The floor matters because futures contracts cannot be split. [2]
Worked Unit-size example
- Assume account equity of
$100,000. - One percent of equity is
$1,000. - Assume
N=1.25points and contract value$400 per point. - Dollar volatility per contract is
1.25×400=$500per N. - Contracts are
floor(1,000/500)=2; one Unit is two contracts. - A 1N adverse move in that Unit is approximately
$1,000, or 1% of starting equity, before slippage and gaps.
If N rises to 2.00 with the same contract value, one contract carries $800 per N and floor(1,000/800)=1 contract. Volatility rose, so size fell. This normalization is one of the system's central ideas, but it does not cap real loss when a market gaps past a stop.
The 2N stop and 0.5N additions
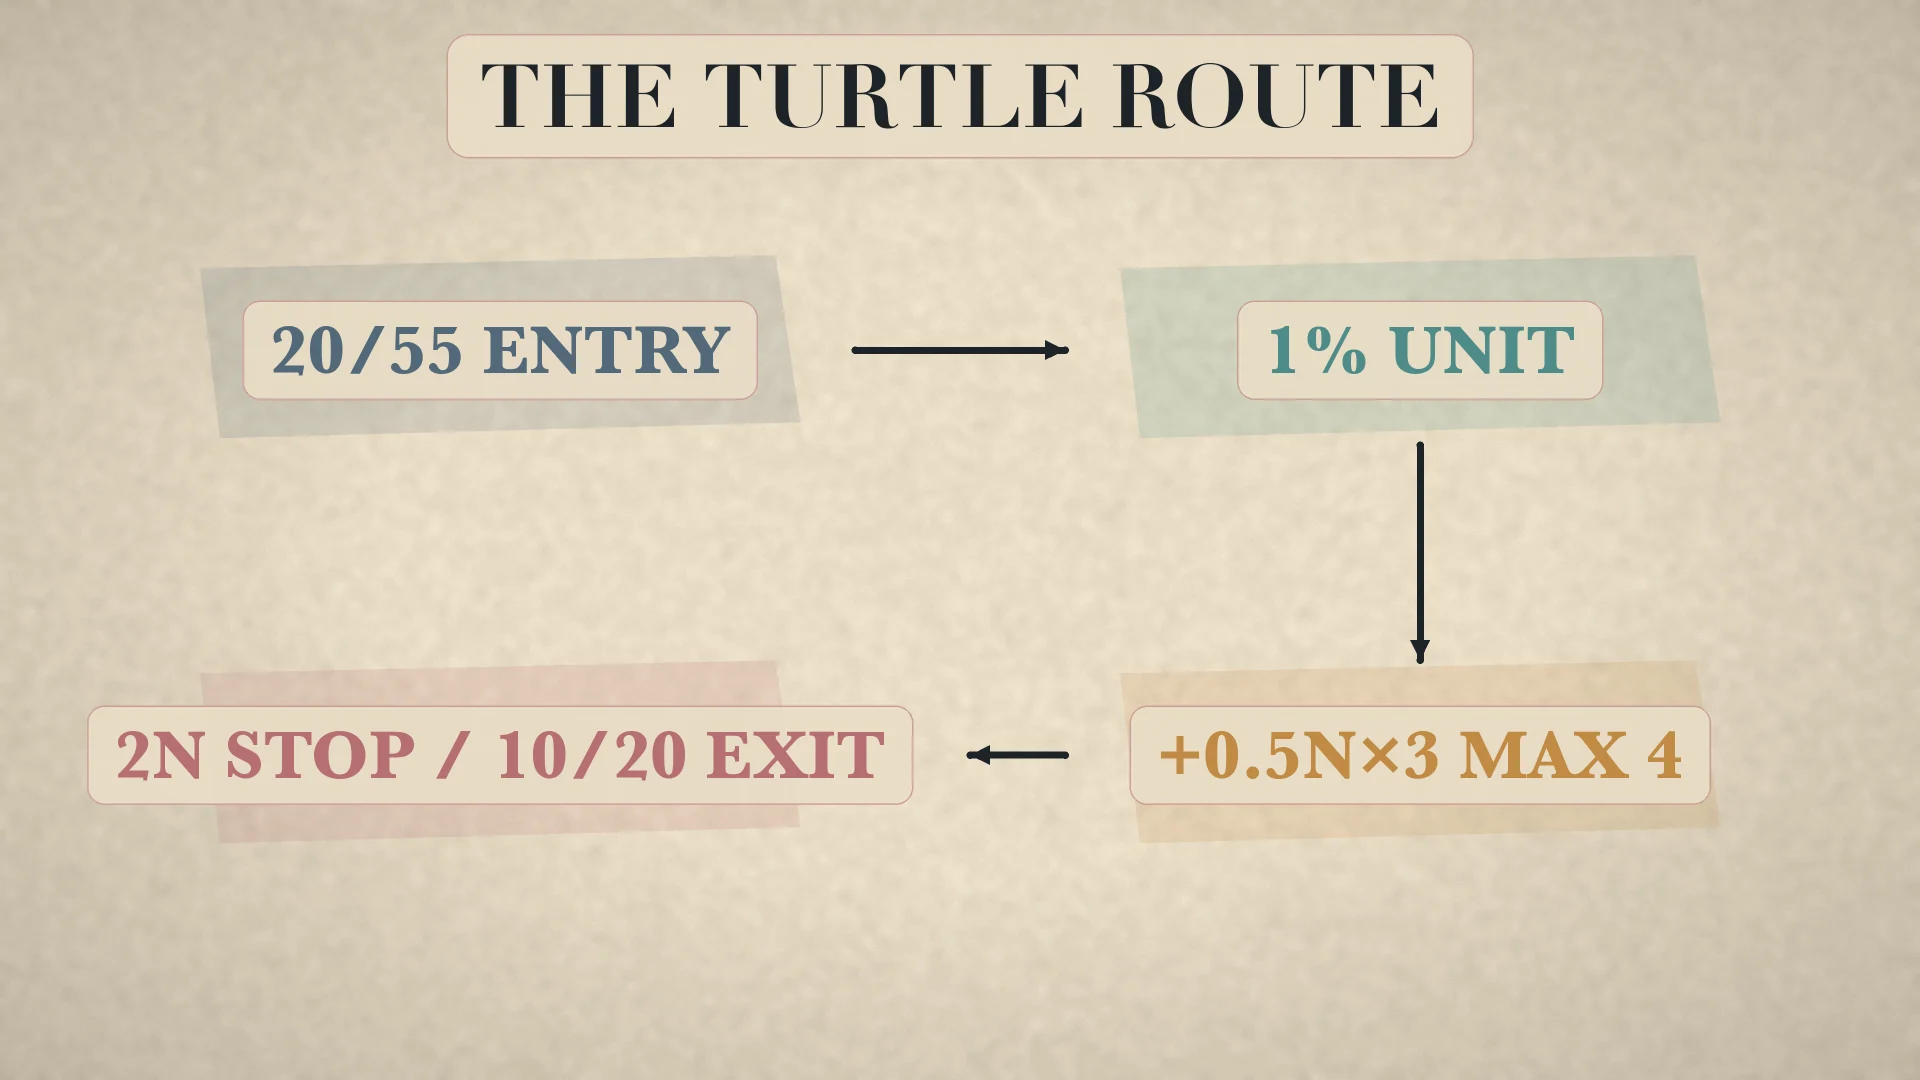
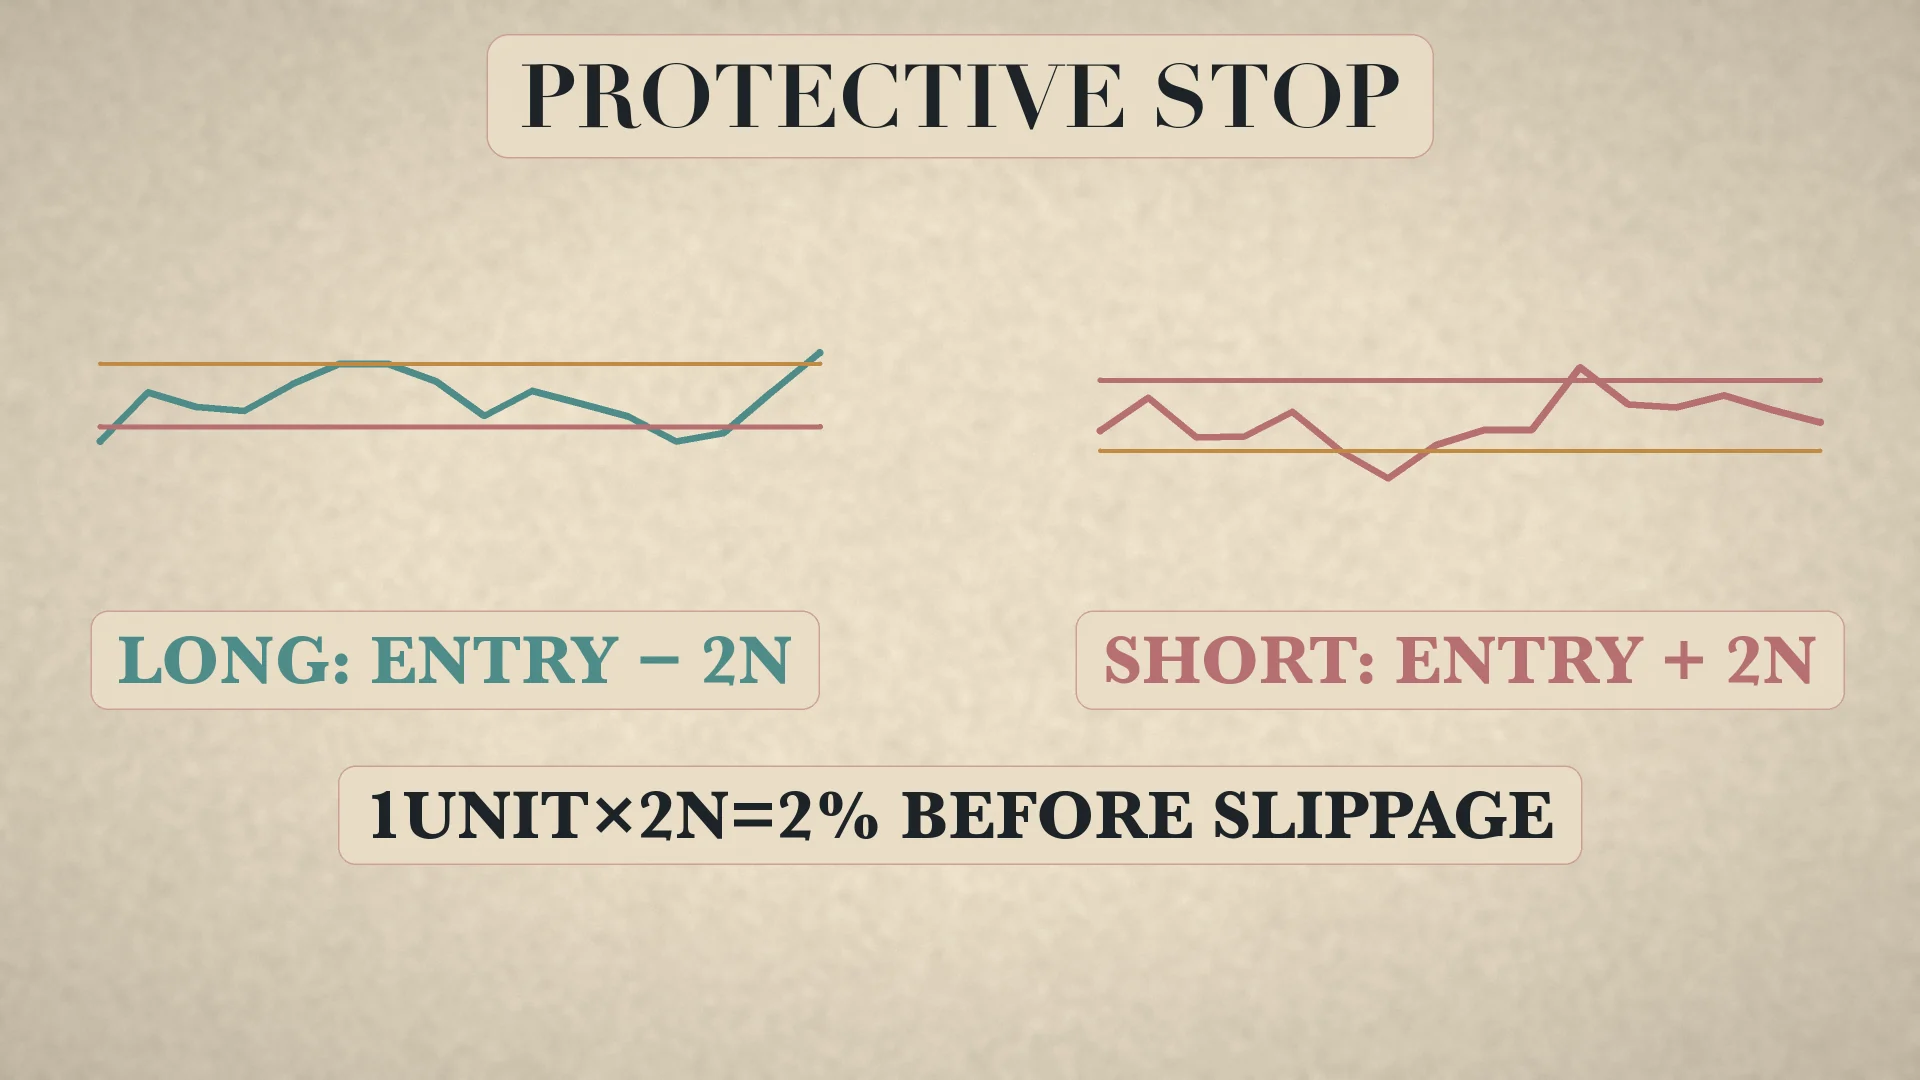
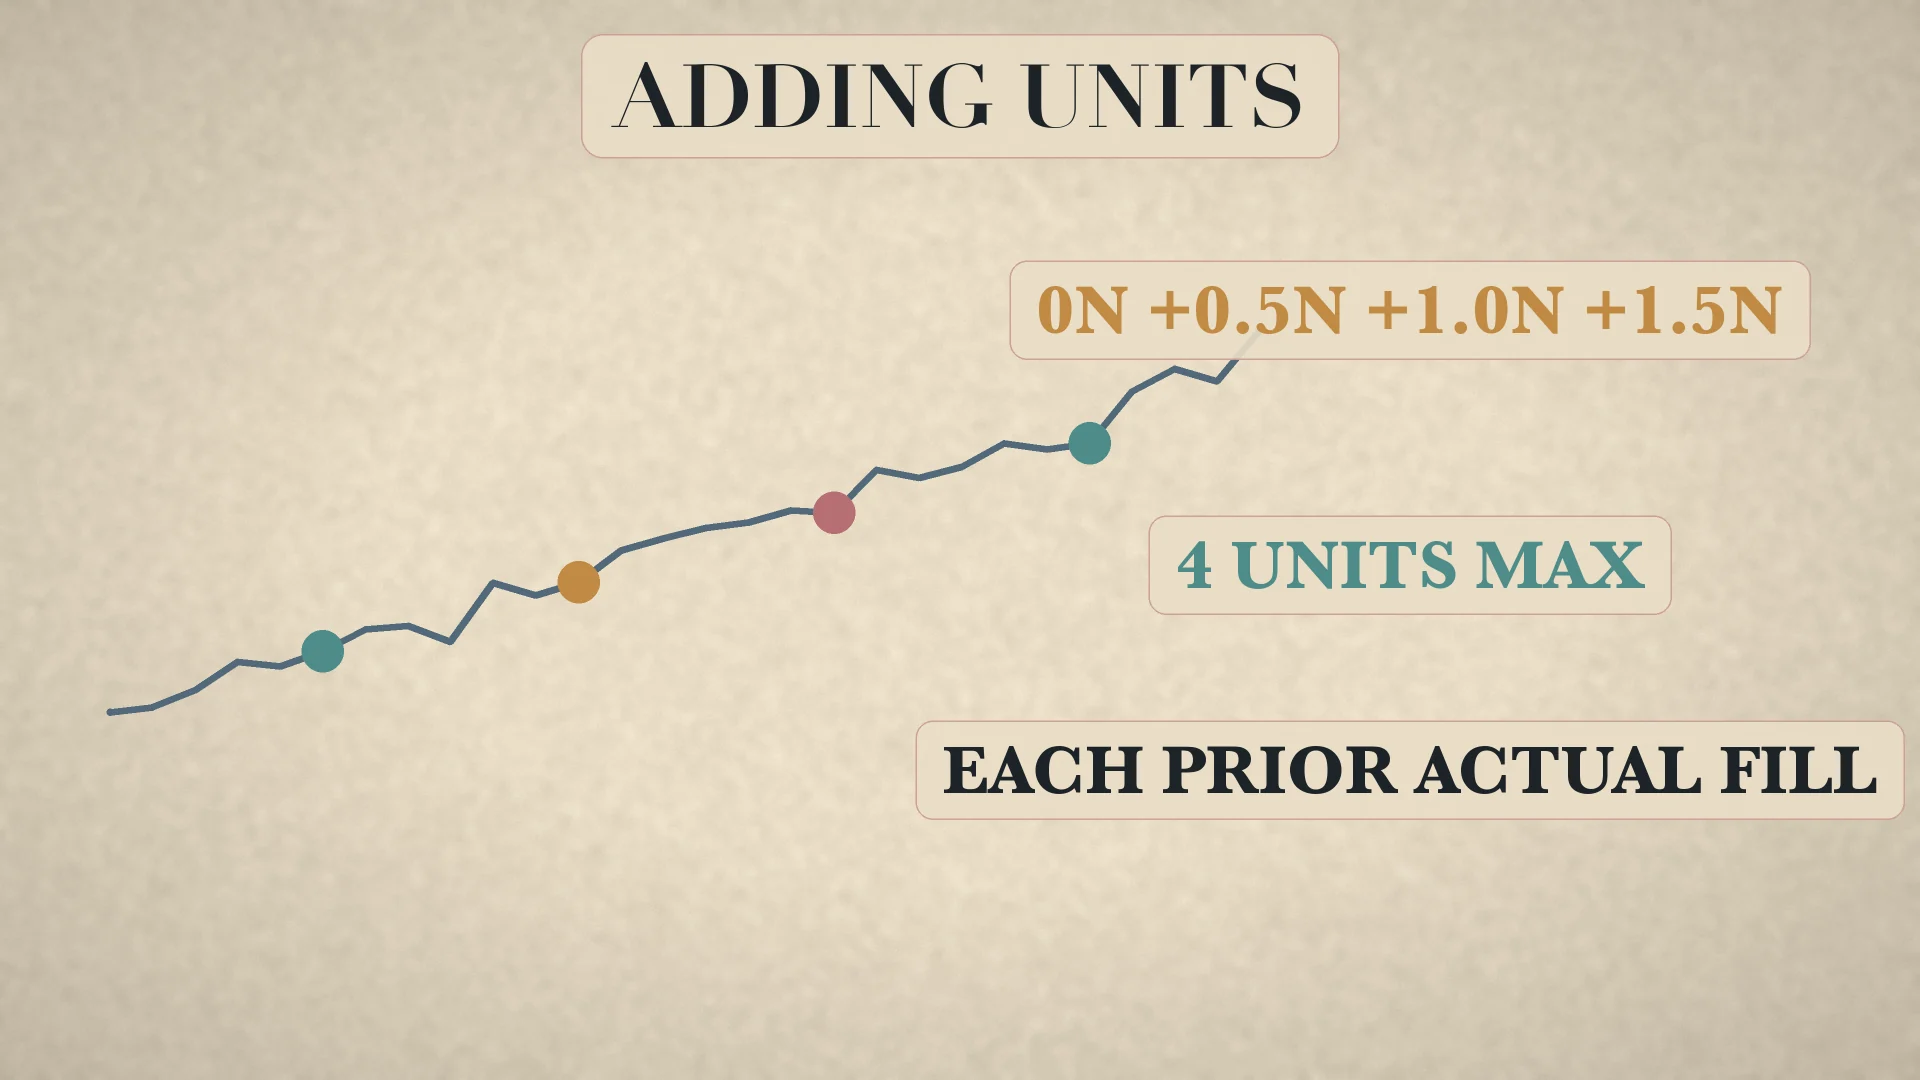
The initial protective stop is 2N below a long entry or 2N above a short entry. Because one Unit is sized so 1N approximates 1% of equity, a 2N adverse move on one Unit corresponds to roughly 2% before slippage. The system then adds Units every 0.5N from the previous actual fill—not from the original breakout quote—up to four Units in one market. [2]
Worked long pyramid
- Let first actual fill be 100 and
N=4. - The initial stop is
100−2×4=92. - Addition spacing is
0.5N=2, so planned fills are 100, 102, 104 and 106 if reached. - After the second Unit fills at 102, raise the earlier stop by 0.5N; normally all stops are kept 2N from the latest addition.
- After the fourth Unit at 106, a common stop location under the published rule is
106−8=98for all Units. - No fifth Unit is allowed in that market.
Actual fills govern the ladder. If slippage moves the second fill from 102 to 102.50, the next 0.5N addition is calculated from 102.50, not from the idealized breakout grid. This prevents the displayed plan from drifting away from executed risk.
Portfolio caps stop correlated positions from hiding risk
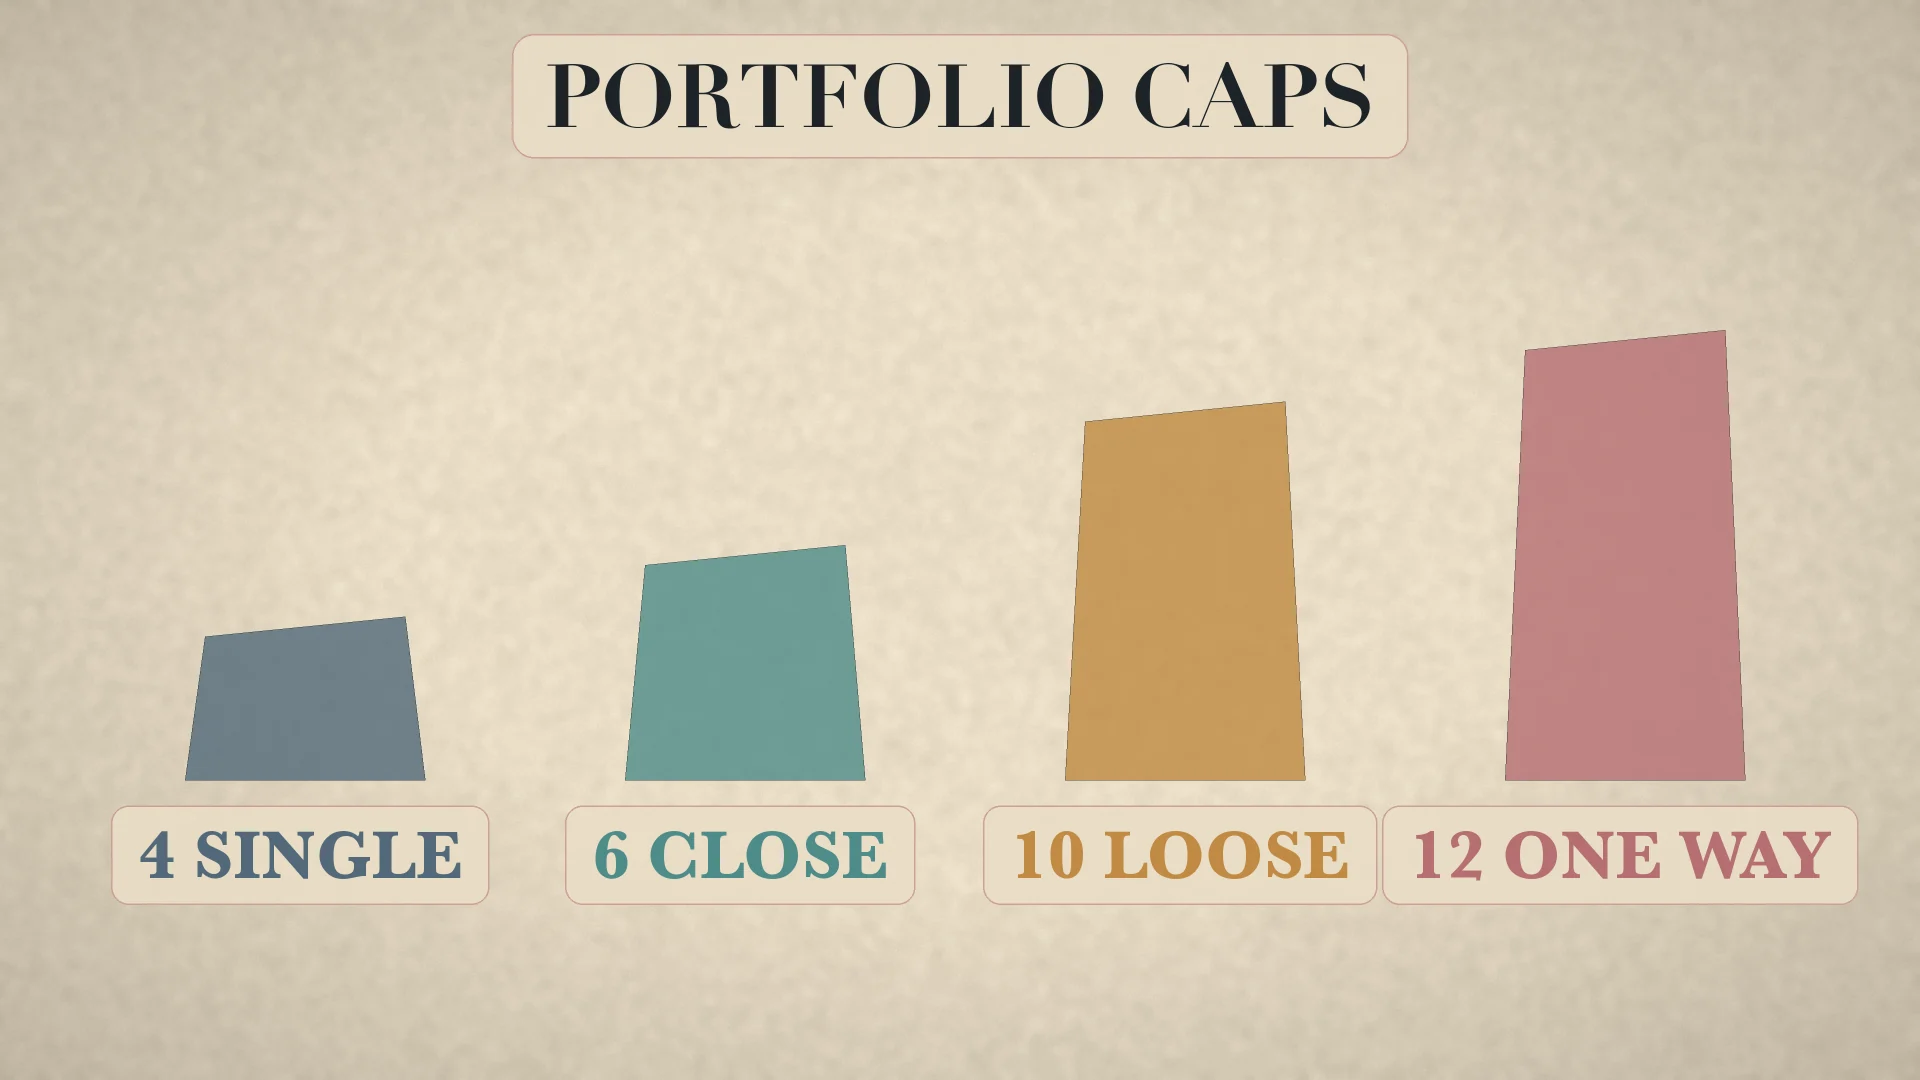
The published limits were four Units in one market, six Units in closely correlated markets, ten Units in loosely correlated markets, and twelve total Units in one direction. These caps are not interchangeable. Four Units in each of several related contracts would still violate the portfolio layer even though every single-market cap looked valid. [2]
An educational pre-entry check therefore counts existing exposure before sending a new breakout order. If five closely correlated Units are already open, only one additional Unit fits the six-Unit cap. If twelve one-way Units are already open, no additional Unit in that direction fits, even in an unrelated market. The exact correlation classification must be defined before results are known.
Channel exits and drawdown discipline
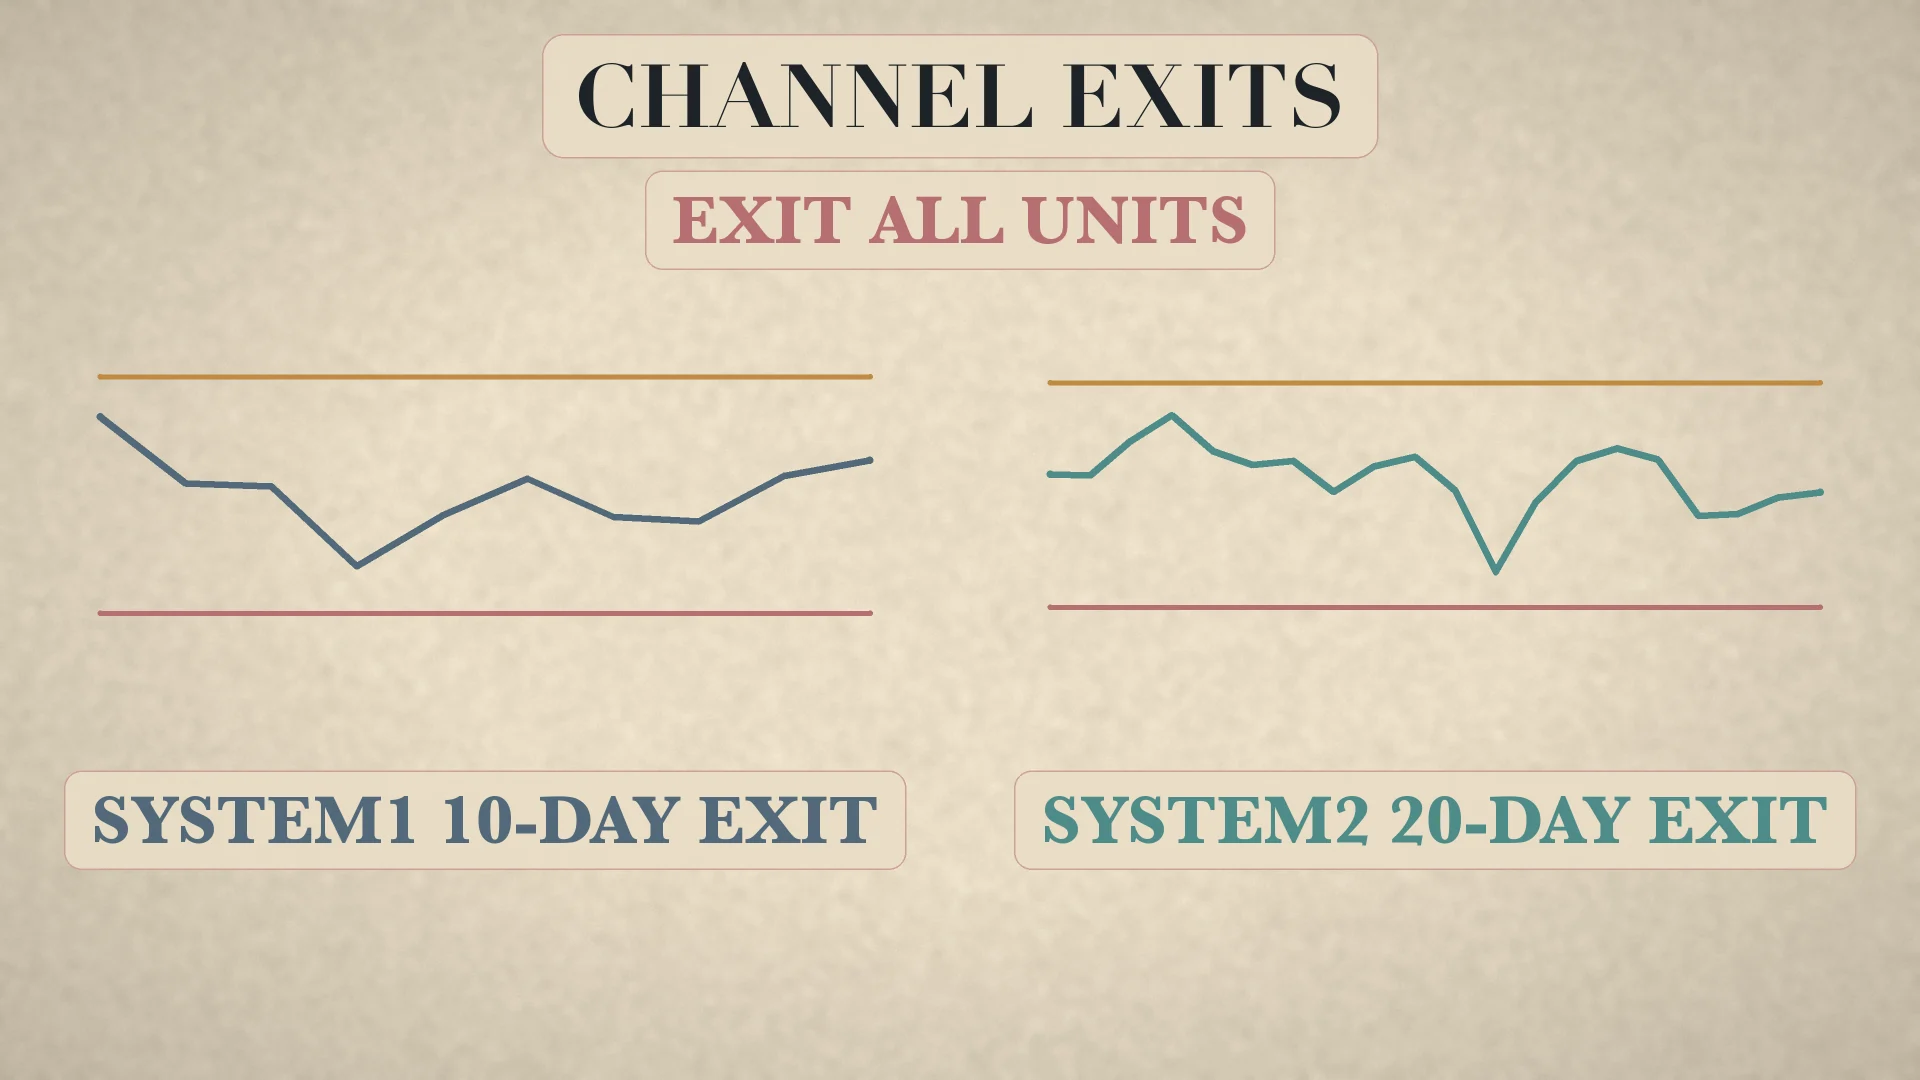
System 1 exits all long Units on a 10-day low and all short Units on a 10-day high. System 2 uses the opposite 20-day extreme. These are exits, not new reverse entries. Because exit lookbacks are shorter than entry lookbacks, the rule gives a trend room to develop but leaves after a meaningful opposite move. [2]
Worked example: a System 1 long holds three Units. The lowest low of the preceding ten days is 88.20. When price trades at the exit threshold, all three Units exit under the rule; the trader does not selectively keep the best fill. A System 2 long would instead watch the preceding 20-day low.
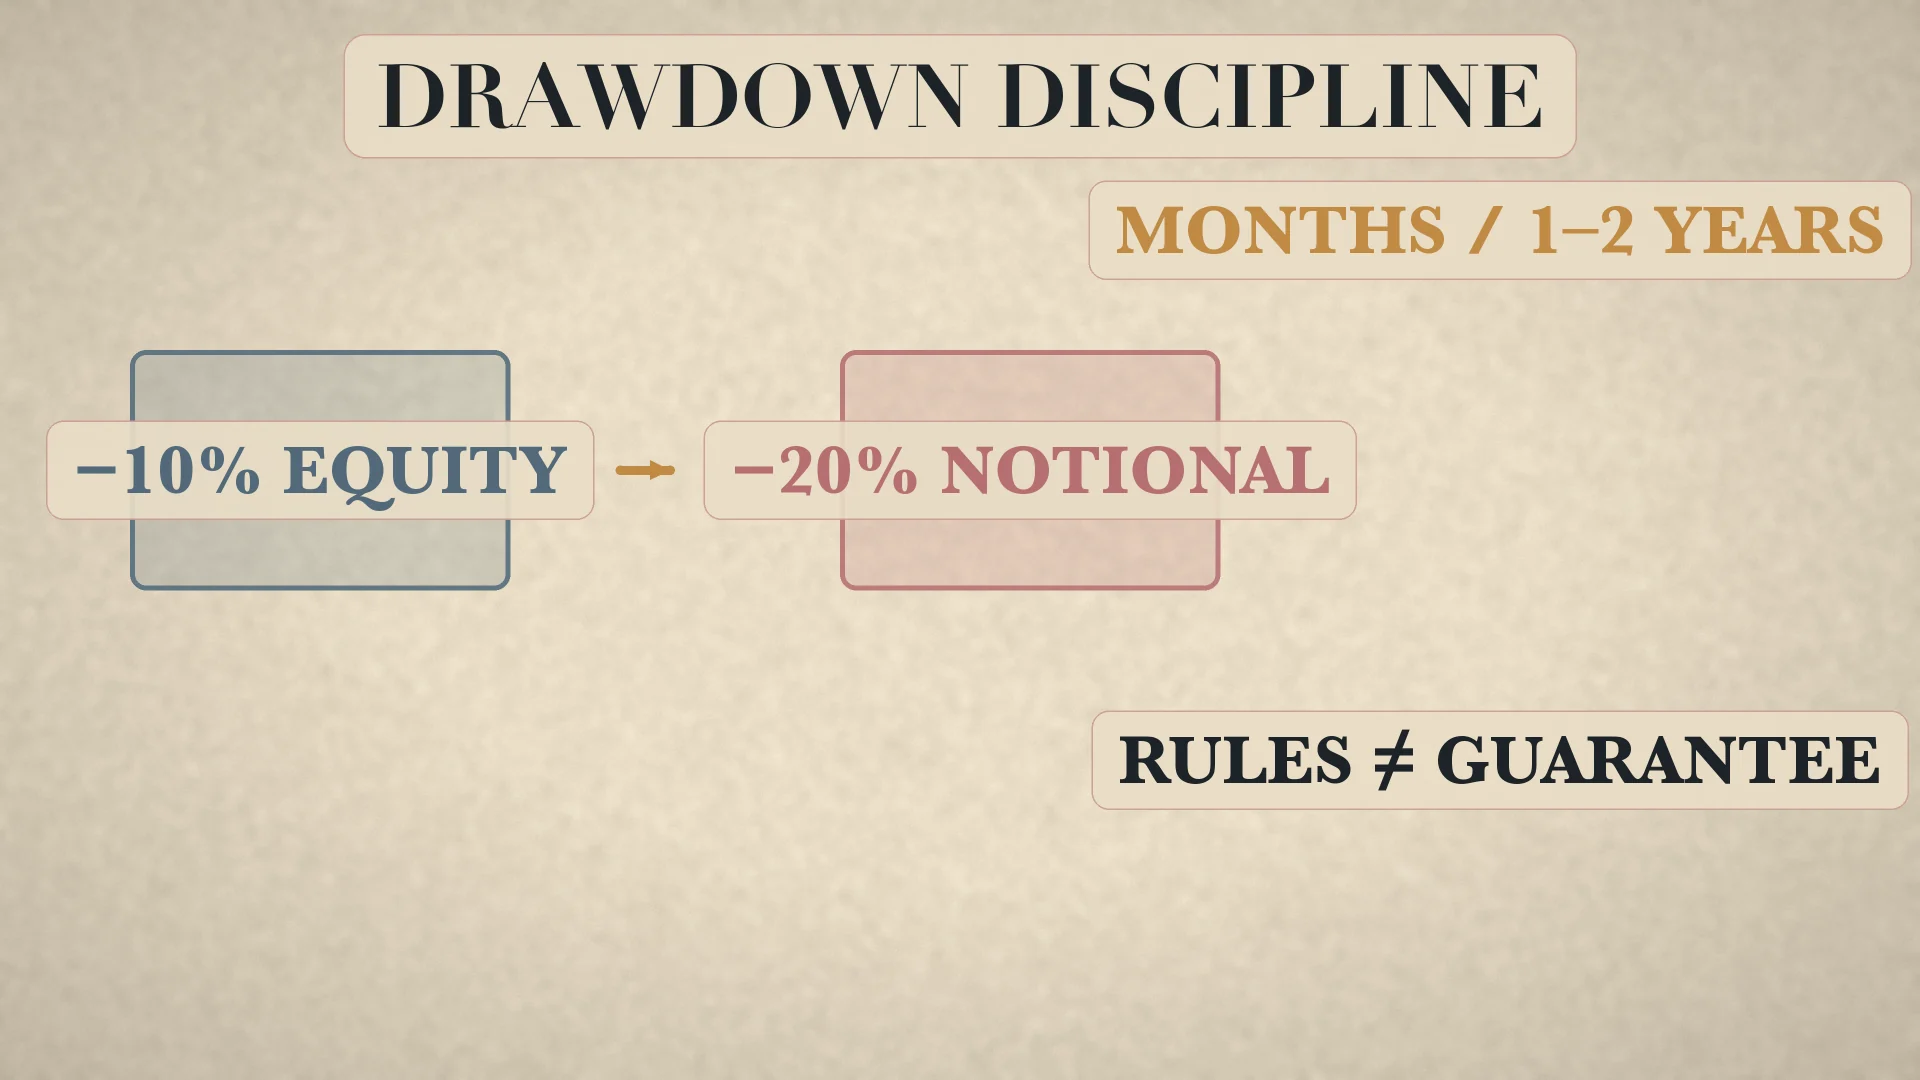
The published drawdown rule reduced the notional account size used for position sizing by 20% whenever equity fell 10% from the current notional base. If the notional base is $100,000 and the trigger is reached, future Unit calculations use $80,000. Another 10% fall measured from that reduced base triggers another 20% notional reduction. This changes size, not the historical account balance.
Worked notional reduction
- Start with a notional sizing base of
$100,000; its 10% trigger is$90,000. - When actual equity reaches the trigger, reduce the sizing base by 20% to
$80,000. - The next 10% trigger is measured from the reduced base:
$72,000. - If that trigger is reached, reduce the sizing base again by 20% to
$64,000. - Future 1% Unit budgets use the current notional base—$800, then $640—not the original $1,000.
A complete educational chart checklist
- Choose System 1 or System 2 and calculate prior channels without look-ahead.
- Calculate TR and update N with the exact 1/20 formula.
- Convert N to dollar volatility and floor the Unit count.
- Check single-market, correlation and directional portfolio caps.
- Place the breakout entry one tick beyond the boundary and define the 2N stop.
- If filled, base each 0.5N addition on the actual preceding fill, maximum four Units.
- Exit all Units on the correct 10-day or 20-day opposite channel.
- Apply the drawdown notional rule and record gaps, commissions and slippage.
Most breakouts do not become lasting trends. The rules document warns that winning periods may be separated by many months and sometimes one or two years. That historical warning is not a forecast of a future waiting period; it explains why consistent execution was treated as part of the system rather than a personality extra.
Common mistakes include calling the origin story a cash wager, mixing System 1 and 2 filters, using a standard EMA instead of Wilder smoothing, sizing before converting N to dollars, adding from theoretical rather than actual fills, forgetting portfolio caps, and using the entry channel as the exit. Trend following cannot predict the next trend or prevent whipsaws. Gaps and slippage can exceed 2N, contracts and markets change, and the historical experiment does not establish current profitability. Exact data, specifications and costs must be tested out of sample.
Teaching diagrams
Glossary
- System 1
- The filtered 20-day breakout with a 55-day failsafe.
- System 2
- The unfiltered 55-day breakout.
- N
- The Turtles' 20-day smoothed True Range measure.
- Unit
- A position size calibrated so 1N equals 1% of equity.
- Pyramiding
- Adding Units every 0.5N from actual fills, up to four.
- Failsafe
- The 55-day entry used when System 1's 20-day signal is skipped.
Frequently asked questions
Was the experiment a documented cash wager?
No. The sources support a debate and real-account experiment, not a documented cash wager.
What is the difference between Systems 1 and 2?
System 1 is a filtered 20-day breakout with a 55-day failsafe; System 2 takes every 55-day breakout.
How many Units could be held in one market?
Up to four, added in 0.5N steps from actual fills.
Do the original rules guarantee profit today?
No. Markets, costs and contracts change; exact current data must be backtested.
Sources
- The Wall Street Journal, Turtles in Chicago (5 September 1989) — www.turtletrader.com
- Curtis Faith, The Original Turtle Trading Rules (2003) — therobusttrader.com
- Trading Blox: the Original Turtles story and rules — www.tradingblox.com
- McGraw Hill: Way of the Turtle (2007) — www.mheducation.com
Educational content only — not financial advice or a promise of performance.