Introduction
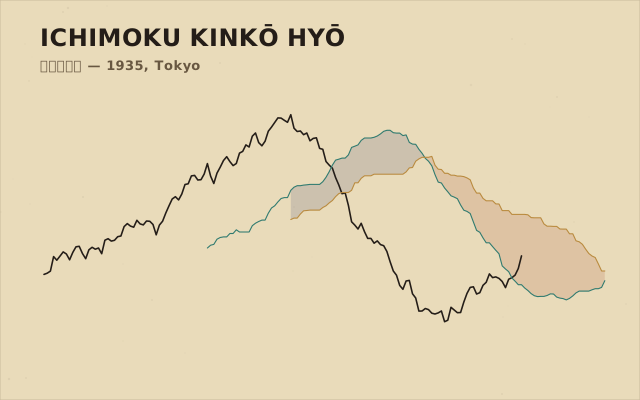
Ichimoku Kinko Hyo (一目均衡表) — "one-glance equilibrium chart" — packs trend, momentum and support/resistance into a single view: five lines and a shaded cloud, all built from nothing more than rolling highs and lows. It was developed by one Japanese market journalist, working by hand, before most of today's technical indicators existed.
This guide walks through it in the order it's usually taught: who built it and why, the five lines and their exact formulas, the cloud those lines create, the honest story behind the 9/26/52 settings and the 26-bar shift, how to read the cloud and its signals in practice, the three-role checklist traders call 三役好転, common mistakes, and — for anyone who wants to go further — the three deeper theories Hosoda built on top of all of this.
None of this is a signal service. The cloud describes probability, not a promise — the checklist is a way to be honest with yourself about what's actually lined up, not a shortcut past confirmation. Educational content only — not financial advice.
Who was Goichi Hosoda
The method's creator was Goichi Hosoda (細田悟一, 1898–1982), a journalist who ran the market section of the Miyako Shimbun (都新聞) — the newspaper that later became today's Tokyo Shimbun. He wrote and published under the pen name Ichimoku Sanjin (一目山人).
In 1935 (Showa 10), Hosoda first printed an early version of his line in the Miyako Shimbun's market column, under the name 新東転換線 (Shinto Tenkansen) — the direct ancestor of what would become the tenkan-sen. More than three decades passed before he explained the full method in public.
There was no charting software in 1935 — every high, low and average behind Hosoda's research was tabulated by hand, day after day, on graph paper. It is said (伝わる) that the full body of calculation behind the finished method represented roughly 2,000 people's labour spread across seven years in total — a figure worth repeating as legend, since it captures how much manual arithmetic sat behind five formulas that look simple today, even if the number itself can't be verified line by line.
Hosoda finally made the complete method public in 1969, in the book 『一目均衡表』 (Ichimoku Kinko Hyo). It was the first of what eventually grew into a series of seven volumes, the last completed by 1981 — each one going deeper into the theory behind the lines than most traders who use the indicator today ever read.
The five lines, with exact formulas
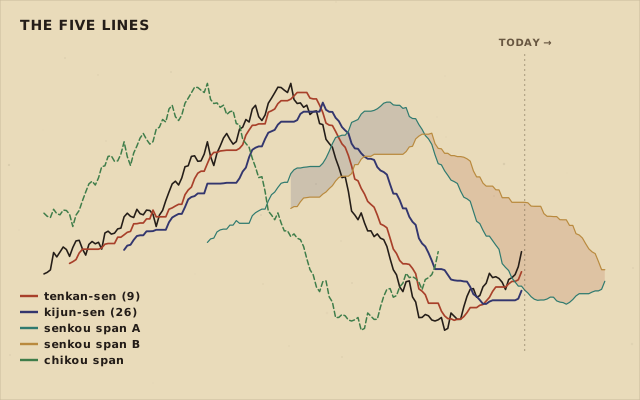
転換線 Tenkan-sen (the conversion line). (highest high + lowest low) ÷ 2, over the last 9 bars. The fastest of the five lines — closer to the market's current mood than a simple moving average, because it only cares about the extremes of the window, not every close inside it.
基準線 Kijun-sen (the base line). (highest high + lowest low) ÷ 2, over the last 26 bars. Slower and steadier than the tenkan-sen; many traders use the kijun-sen alone as a trend filter, the way others use a long moving average.
先行スパン1 Senkou Span A (leading span A). The midpoint of the tenkan-sen and kijun-sen, plotted 26 bars ahead of the current price. It is the faster of the two lines that form the edges of the cloud.
先行スパン2 Senkou Span B (leading span B). (highest high + lowest low) ÷ 2, over the last 52 bars, also plotted 26 bars ahead. The slower cloud edge — because it looks back twice as far as the kijun-sen, it moves more slowly and tends to mark the sturdier boundary of the two.
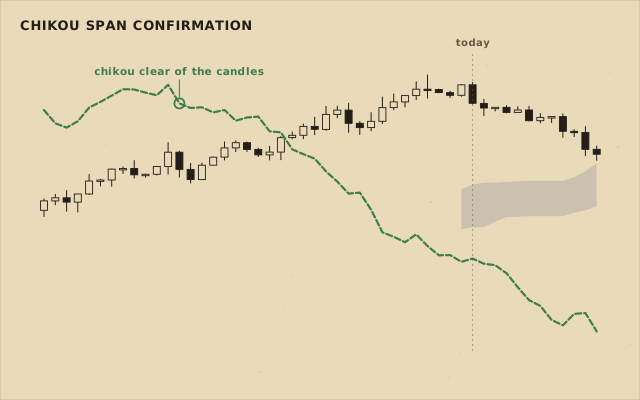
遅行スパン Chikou Span (the lagging span). Today's closing price, plotted 26 bars back over the price action that already happened. It isn't a forecast at all — it's a way of comparing today's close against where price stood 26 bars earlier, at a glance.
On the 26-bar shift itself: Hosoda's own teaching counts today as the first of the 26 bars, which works out to a 25-bar array shift. Most trading platforms' code shifts a full 26 positions instead. It's a one-bar difference that rarely changes the read, but it explains why a cloud plotted by hand from the original method and a cloud plotted by your charting software can land one bar apart. The diagrams in this guide use the common platform convention — a 26-bar shift — since that's what you'll see on a real chart.
The cloud (雲, kumo)
The space between senkou span A and senkou span B — plotted 26 bars into the future — is the kumo (雲), the cloud. It isn't a prediction of price; it's a projection of where the last 26 and 52 bars' highs and lows would put a support/resistance zone if the market's recent range holds up. Because both spans are built from real price history, the cloud you see today was actually "written" 26 bars ago — it just hasn't arrived yet.
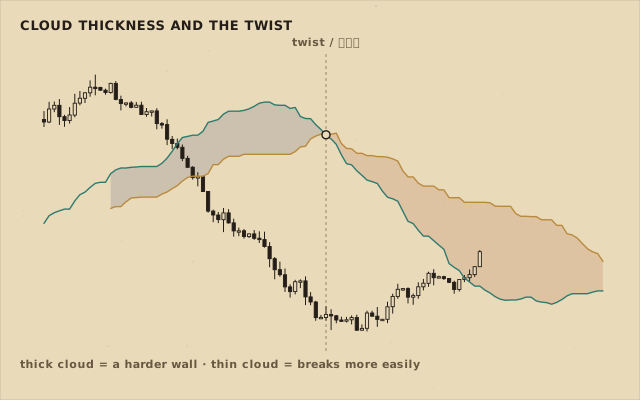
Cloud thickness is information on its own. A thick cloud (a wide gap between span A and span B) reflects a stretch where the 26-bar and 52-bar ranges disagreed a lot — usually a strong trending period — and tends to act like a harder wall: price has more work to do to punch through it. A thin cloud reflects a quieter, narrower-range stretch and breaks more easily.
The point where senkou span A and senkou span B cross is the twist (ねじれ) — it's also the point where the cloud's fill colour flips between bullish and bearish. Because the spans are plotted in advance, a twist coming up on the chart marks a specific future date the method flags as a possible turning point in time, not a price level. It's one of the few technical-analysis ideas built around timing a turn rather than a price.
The 9, 26 and 52 bar counts are commonly explained (と言われる, "it is said") as roughly one and a half weeks, one month and two months of Japan's old six-day trading week — Saturdays were trading days when Hosoda built the method. That explanation is the one most often repeated, though exactly why Hosoda chose these three numbers is not something this guide can verify beyond that common account.
How to read it
- Above the cloud — the broad context is bullish; the cloud below acts as support if price pulls back toward it.
- Below the cloud — the broad context is bearish; the cloud above acts as resistance.
- Inside the cloud — no clear read; many traders treat this as a zone to wait out rather than trade.
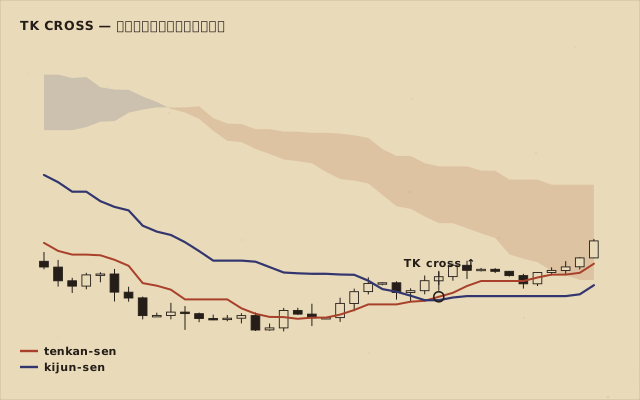
- TK cross (転換線と基準線の交差) — tenkan-sen crossing above kijun-sen reads as a turn for the better; crossing below reads as the reverse. The same cross means more when it happens above (or below) the cloud than when it happens deep inside one.
- Thick vs thin cloud — treat a thick cloud ahead as a stronger wall worth respecting, and a thin one as a level more likely to give way.
- Twist (ねじれ) — mark the date where span A and span B cross ahead of price; the method flags that date as a plausible turning time, worth watching rather than trading blind.
- Chikou confirmation (遅行スパンの確認) — check that the chikou span (today's close, plotted back 26 bars) sits clear of the candles from that time, and ideally clear of the cloud too. A chikou span tangled up in old price action is a weaker read than one sitting clearly above or below it.
The 三役好転 / 三役逆転 checklist
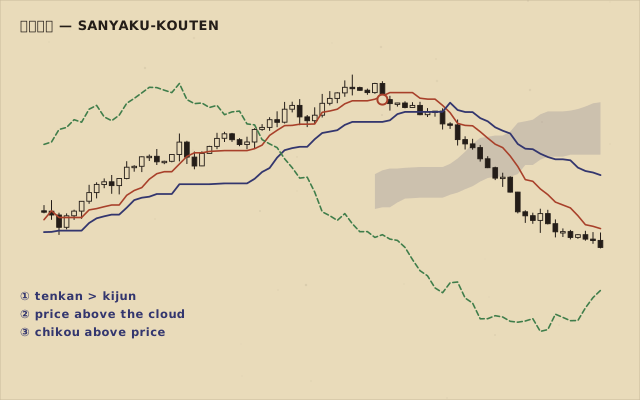
三役好転 (sanyaku-kouten, roughly "the three roles turning favourable") is what many Ichimoku traders treat as the strongest bullish confirmation the method offers: three separate conditions lining up together, rather than any one line acting alone.
- ① Tenkan-sen above kijun-sen — the TK cross has already turned bullish.
- ② Price above the cloud — both senkou spans sit below the candles.
- ③ Chikou span above price — today's close sits higher than price stood 26 bars ago.
三役逆転 (sanyaku-gyakuten) is the exact mirror for the bearish case: tenkan-sen below kijun-sen, price below the cloud, chikou span below price. Traders who wait for all three before acting are trading the method's strongest available signal, at the cost of being later to the first move than a trader acting on just one condition.
- In practice — check the three conditions on a closed bar, not an intrabar touch; note which condition confirmed last (it's usually the chikou span, since it depends on where price sat 26 bars later); and decide in advance what would prove the read wrong, such as price closing back inside the cloud.
Common mistakes
- Reading the cloud on one timeframe only, and ignoring what the same instrument's cloud looks like a timeframe up — a thick daily cloud can sit right through a clean-looking hourly signal.
- Trading Ichimoku signals inside a flat, range-bound market. The method is built for trending conditions; a thin, sideways cloud gets pierced constantly and produces one false TK cross after another.
- Treating a cloud edge as a guaranteed bounce or reversal. It's a probabilistic zone built from past ranges, not a promise about what price does next.
- Skipping the chikou span. It's the easiest of the five lines to ignore, because it sits behind the candles rather than ahead of them — but a bullish read with an unconfirmed or tangled chikou span is missing a third of the sanyaku checklist.
- Applying the classic 9/26/52 settings unchanged to a 24/7 market like crypto without a second thought. Those numbers came from a six-day trading week that hasn't existed for decades even in Japan; some traders rescale the periods for a seven-day week (for example 10, 30 and 60), others keep the original numbers because the ratios between the three periods still roughly hold either way. Both camps have a real argument — this guide isn't taking a side.
Go deeper: Hosoda's three theories
The five lines and the cloud are only the visible surface of what Hosoda actually built. His complete method rests on three linked theories he spent the later Ichimoku Kinko Hyo volumes developing in full: 時間論 (jikanron, time theory) — about timing market turns, the idea the twist above is one small, visible piece of; 波動論 (hadouron, wave theory) — about the wave-like shape price advances and declines tend to take; and 値幅観測論 (nehaba-kansokuron, price-range theory) — about projecting how far a move might travel from the ranges that came before it.
This guide only covers the five lines and the cloud that most charting software draws automatically. The three theories behind them are a study of their own — mostly written about in Japanese, and rarely taught in full outside it.
Glossary
- Ichimoku Kinko Hyo (一目均衡表)
- "One-glance equilibrium chart" — the full method: five lines plus the kumo cloud, built by Goichi Hosoda.
- Tenkan-sen (転換線)
- (9-bar high + low) ÷ 2 — the fastest of the five lines.
- Kijun-sen (基準線)
- (26-bar high + low) ÷ 2 — often used alone as a trend filter.
- Senkou Span A (先行スパン1)
- Midpoint of tenkan-sen and kijun-sen, plotted 26 bars ahead.
- Senkou Span B (先行スパン2)
- (52-bar high + low) ÷ 2, plotted 26 bars ahead — the slower cloud edge.
- Chikou Span (遅行スパン)
- Today's close, plotted 26 bars back over past price action.
- Kumo / cloud (雲)
- The shaded area between senkou span A and B — a projected support/resistance zone.
- Twist (ねじれ)
- The point where span A and span B cross and the cloud's colour flips.
- TK cross
- Tenkan-sen crossing kijun-sen, upward or downward.
- Sanyaku-kouten (三役好転)
- The three-role bullish alignment: TK cross up, price above cloud, chikou above price.
- Sanyaku-gyakuten (三役逆転)
- The mirror bearish alignment of sanyaku-kouten.
- Jikanron (時間論, time theory)
- Hosoda's theory of timing market turns; the twist is one visible piece of it.
- Hadouron (波動論, wave theory)
- Hosoda's theory of the wave-like shape price advances and declines tend to take.
- Nehaba-kansokuron (値幅観測論, price-range theory)
- Hosoda's theory for projecting how far a move might travel from past ranges.
Frequently asked questions
What does Ichimoku Kinko Hyo mean?
"One-glance equilibrium chart" — a chart built to show trend, momentum and support/resistance in a single view, without stacking separate indicators on top of price.
Who invented Ichimoku Kinko Hyo?
Goichi Hosoda (1898–1982), a Japanese market journalist who wrote under the pen name Ichimoku Sanjin. He first printed an early version of the line in 1935 and published the full method in 1969.
What are the five lines?
Tenkan-sen (9-bar high/low midpoint), kijun-sen (26-bar), senkou span A (midpoint of tenkan and kijun, shifted forward), senkou span B (52-bar, shifted forward), and the chikou span (today's close, shifted back).
What is the cloud (kumo)?
The shaded area between senkou span A and senkou span B, projected 26 bars into the future. It marks a probable support/resistance zone built from the last 26 and 52 bars' price extremes, not a prediction of price.
What is a TK cross?
Tenkan-sen crossing kijun-sen. Crossing upward reads as a turn for the better; crossing downward reads as the reverse. It means more when it happens above or below the cloud than deep inside one.
What is sanyaku-kouten (三役好転)?
The strongest bullish confirmation the method offers: tenkan-sen above kijun-sen, price above the cloud, and the chikou span above price, all lining up together. Sanyaku-gyakuten (三役逆転) is the exact bearish mirror.
Should the 9/26/52 settings change for crypto or other 24/7 markets?
It's genuinely debated. The numbers originated from Japan's old six-day trading week; some traders rescale them for a seven-day week, others keep the classic settings because the ratios between the three periods hold up either way. This guide doesn't take a side.
Is Ichimoku Kinko Hyo a guaranteed trading system?
No. It describes patterns and a way of reading price, time and trend together that recur often enough to study, not a signal that guarantees any outcome. Educational content only — not financial advice.
Sources
- Ichimoku Kinkō Hyō · Wikipedia
Creator, the five line formulas, and the 9/26/52 six-day-week explanation. - Ichimoku Cloud · StockCharts ChartSchool
Formulas and practical reading of the cloud, TK cross and chikou span. - Ichimoku: What Was Lost in Translation — Back to Its Genesis · TradingView (IchimokuEdge)
Hosoda's biography, the 1935 Shinto Tenkansen, hand-tabulated research, and the three theories' Japanese names. - What Is The Ichimoku Cloud? · Fidelity Learning Center
General reader-facing overview of the components and how they're used together.