
From a Wall Street news service to two market averages
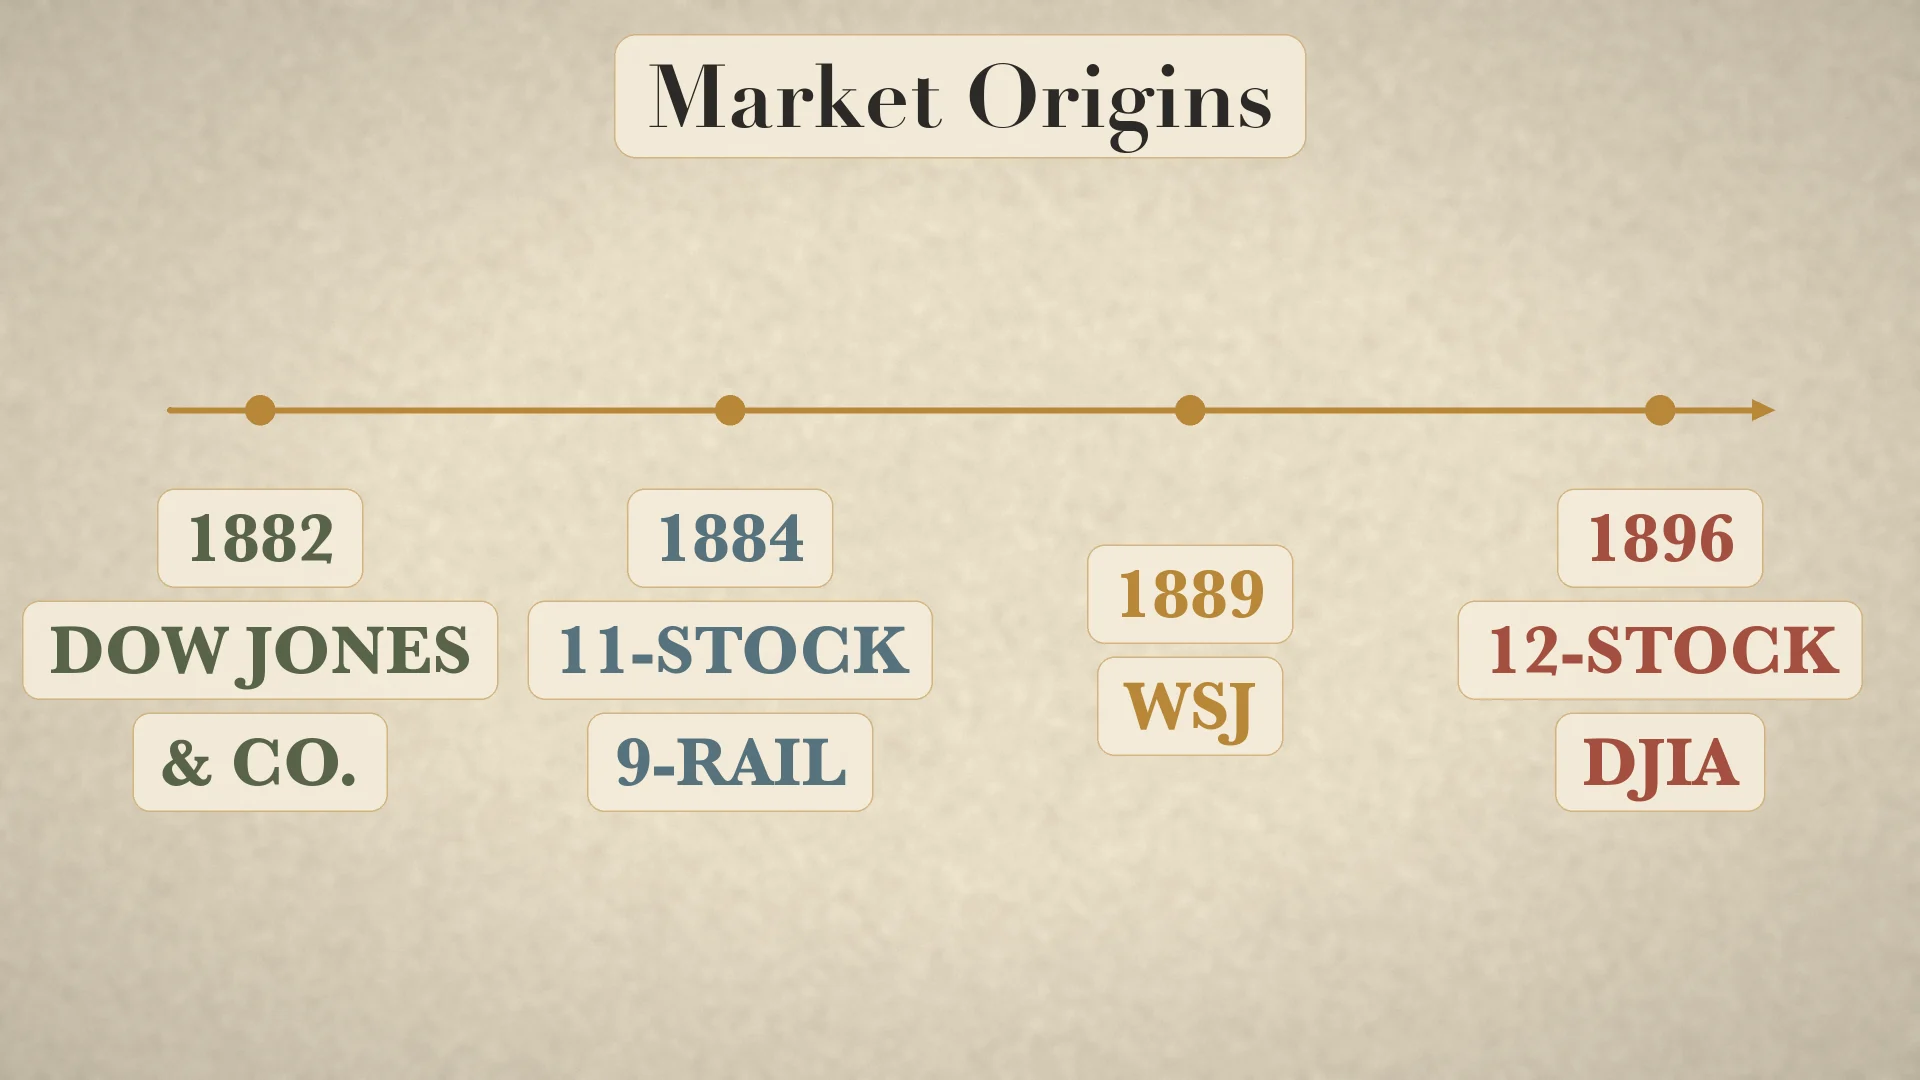
Dow Theory did not begin as an indicator package. It began with financial reporting. Charles Henry Dow was born on 6 November 1851 in Sterling, Connecticut, and later became a financial journalist. In 1882 he formed Dow Jones & Co. in New York with Edward D. Jones and Charles M. Bergstresser. Their hand-delivered news operation grew from a Wall Street basement into the Customer's Afternoon Letter and then The Wall Street Journal, whose first four-page, two-cent issue appeared on 8 July 1889. [1][2]
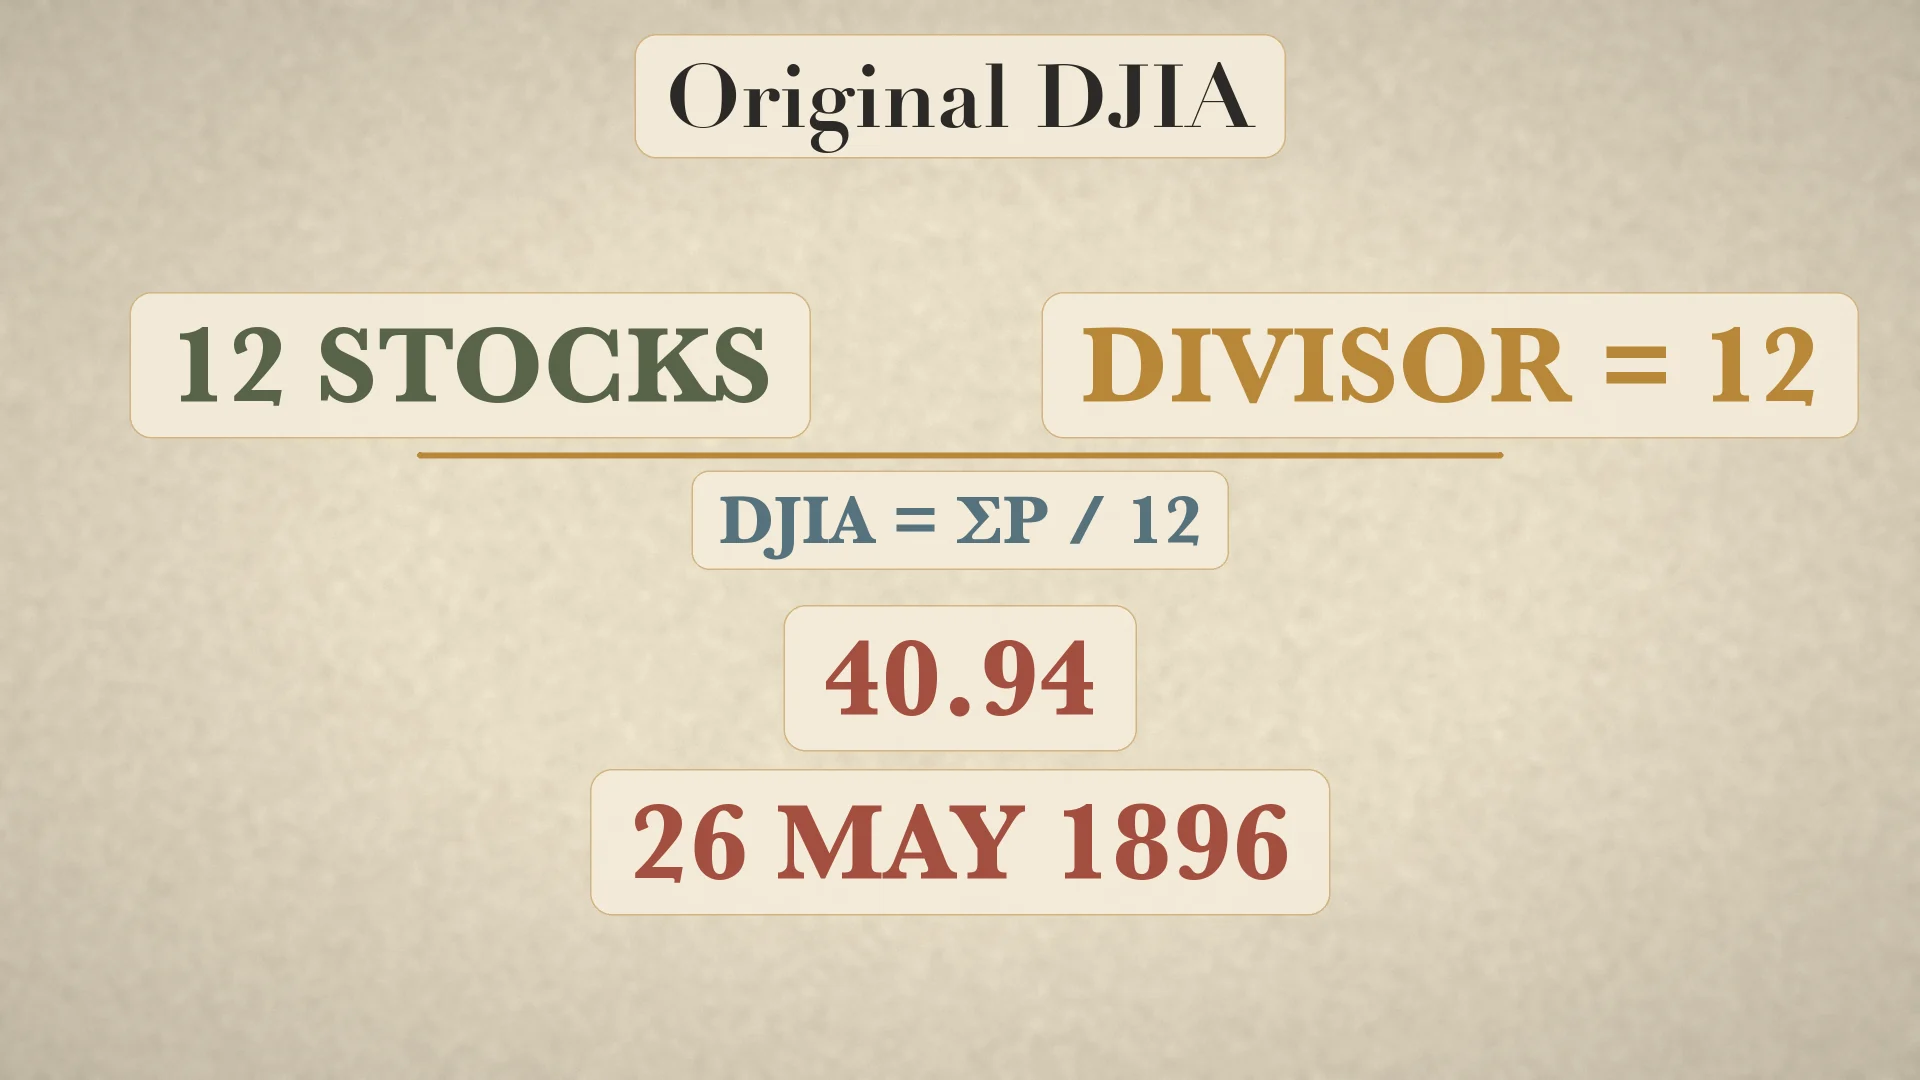
The averages were reporting tools before they became a theory. Dow's first stock average appeared on 3 July 1884. It contained 11 stocks, nine of them railroads. On 26 May 1896 the Dow Jones Industrial Average debuted with 12 industrial companies at 40.94. The arithmetic was literal: add the twelve prices and divide by twelve, or DJIA = (P1 + P2 + ... + P12) / 12. The industrial average complemented the older railroad average, now called the Transportation Average. [3]
Worked arithmetic example
- Suppose twelve component prices sum to 491.28.
- Use the original 1896 divisor:
12. - Calculate
491.28 / 12 = 40.94. - That reproduces the first published value. It teaches the original method, not the modern divisor-adjusted index calculation.
The economic intuition behind confirmation was concrete: industrial companies made goods and railroads moved them. If both groups advanced through meaningful prior highs, the broad movement carried more evidential weight than an isolated move in one average. This was observation, not a claim that two lines could forecast every turn.
Dow's observations became Dow Theory after Dow
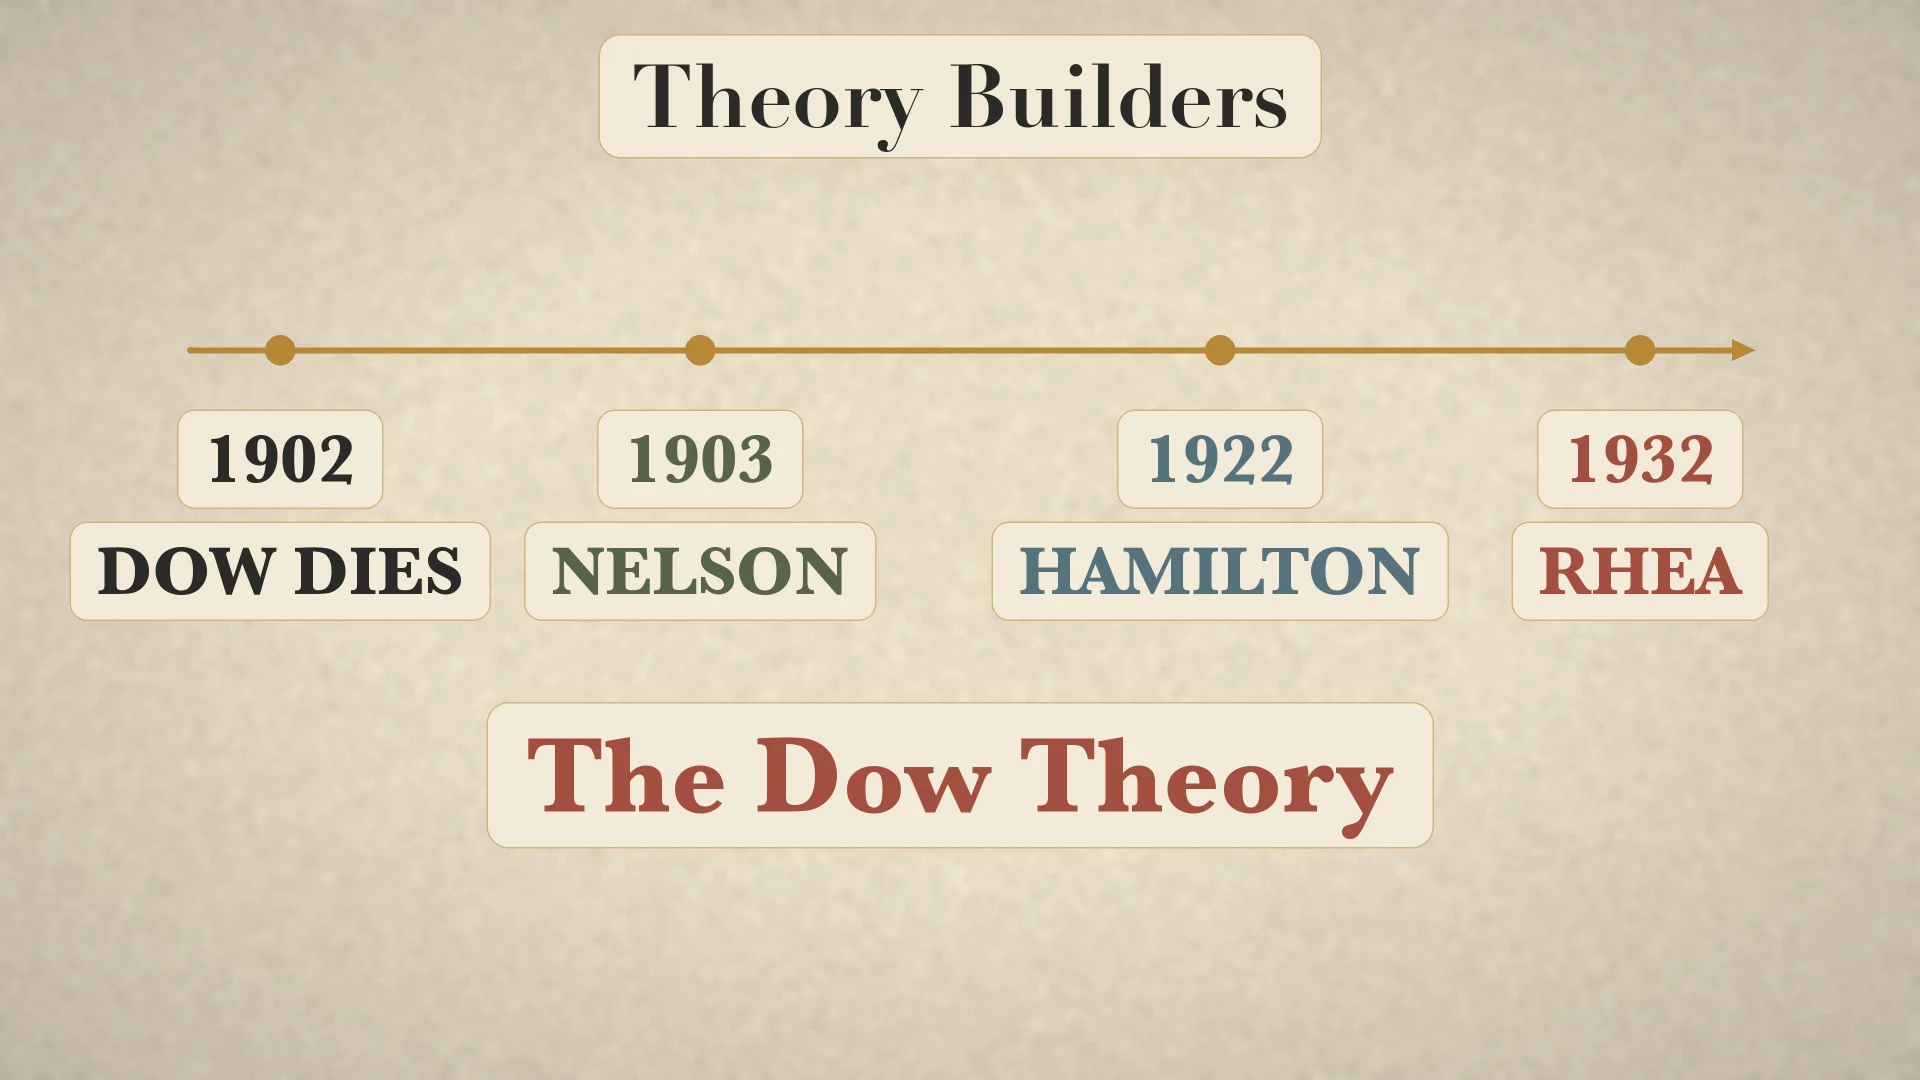
Dow died on 4 December 1902. He left editorials, not a book titled Dow Theory and not today's canonical six-point checklist. S. A. Nelson's 1903 The A B C of Stock Speculation reproduced Dow material and explicitly used the phrase “Dow's Theory.” William Peter Hamilton developed the ideas in Wall Street Journal editorials and in The Stock Market Barometer in 1922. Robert Rhea systematized Dow and Hamilton in The Dow Theory in 1932. [4][5]
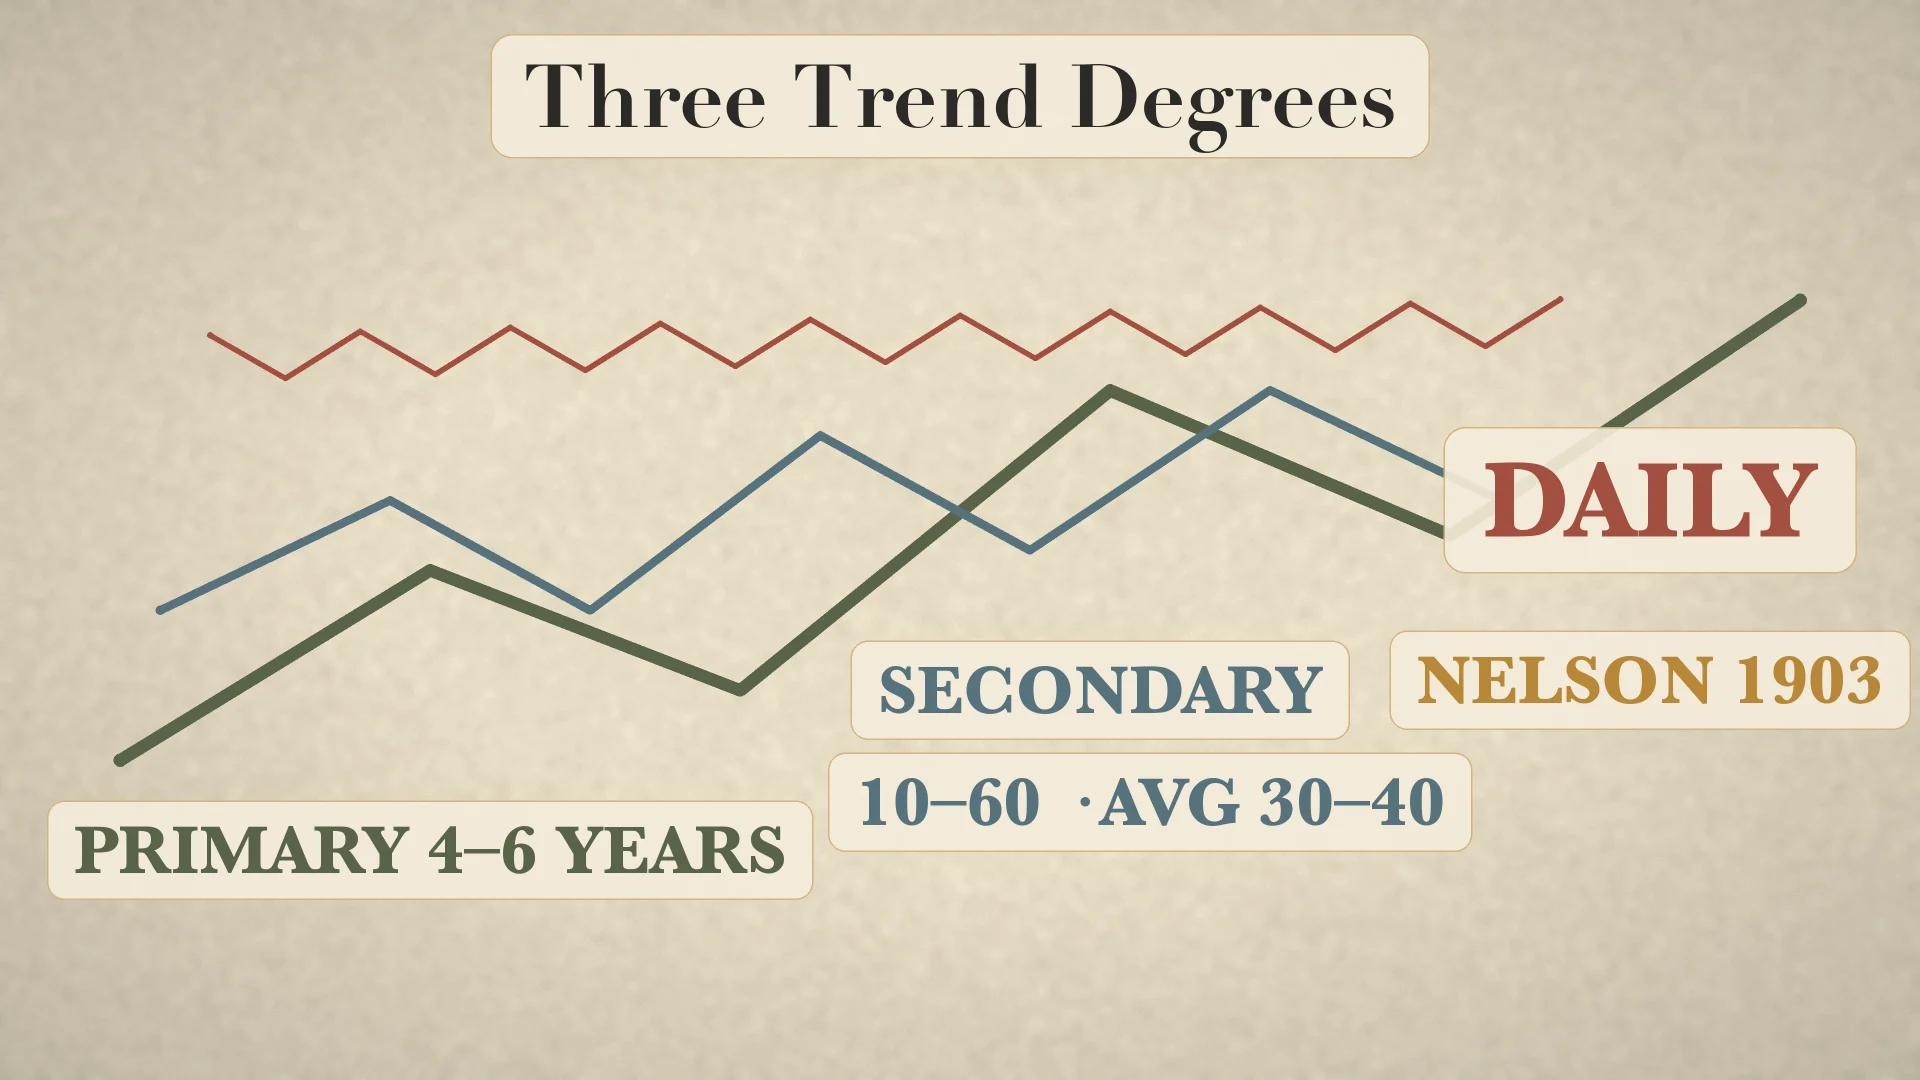
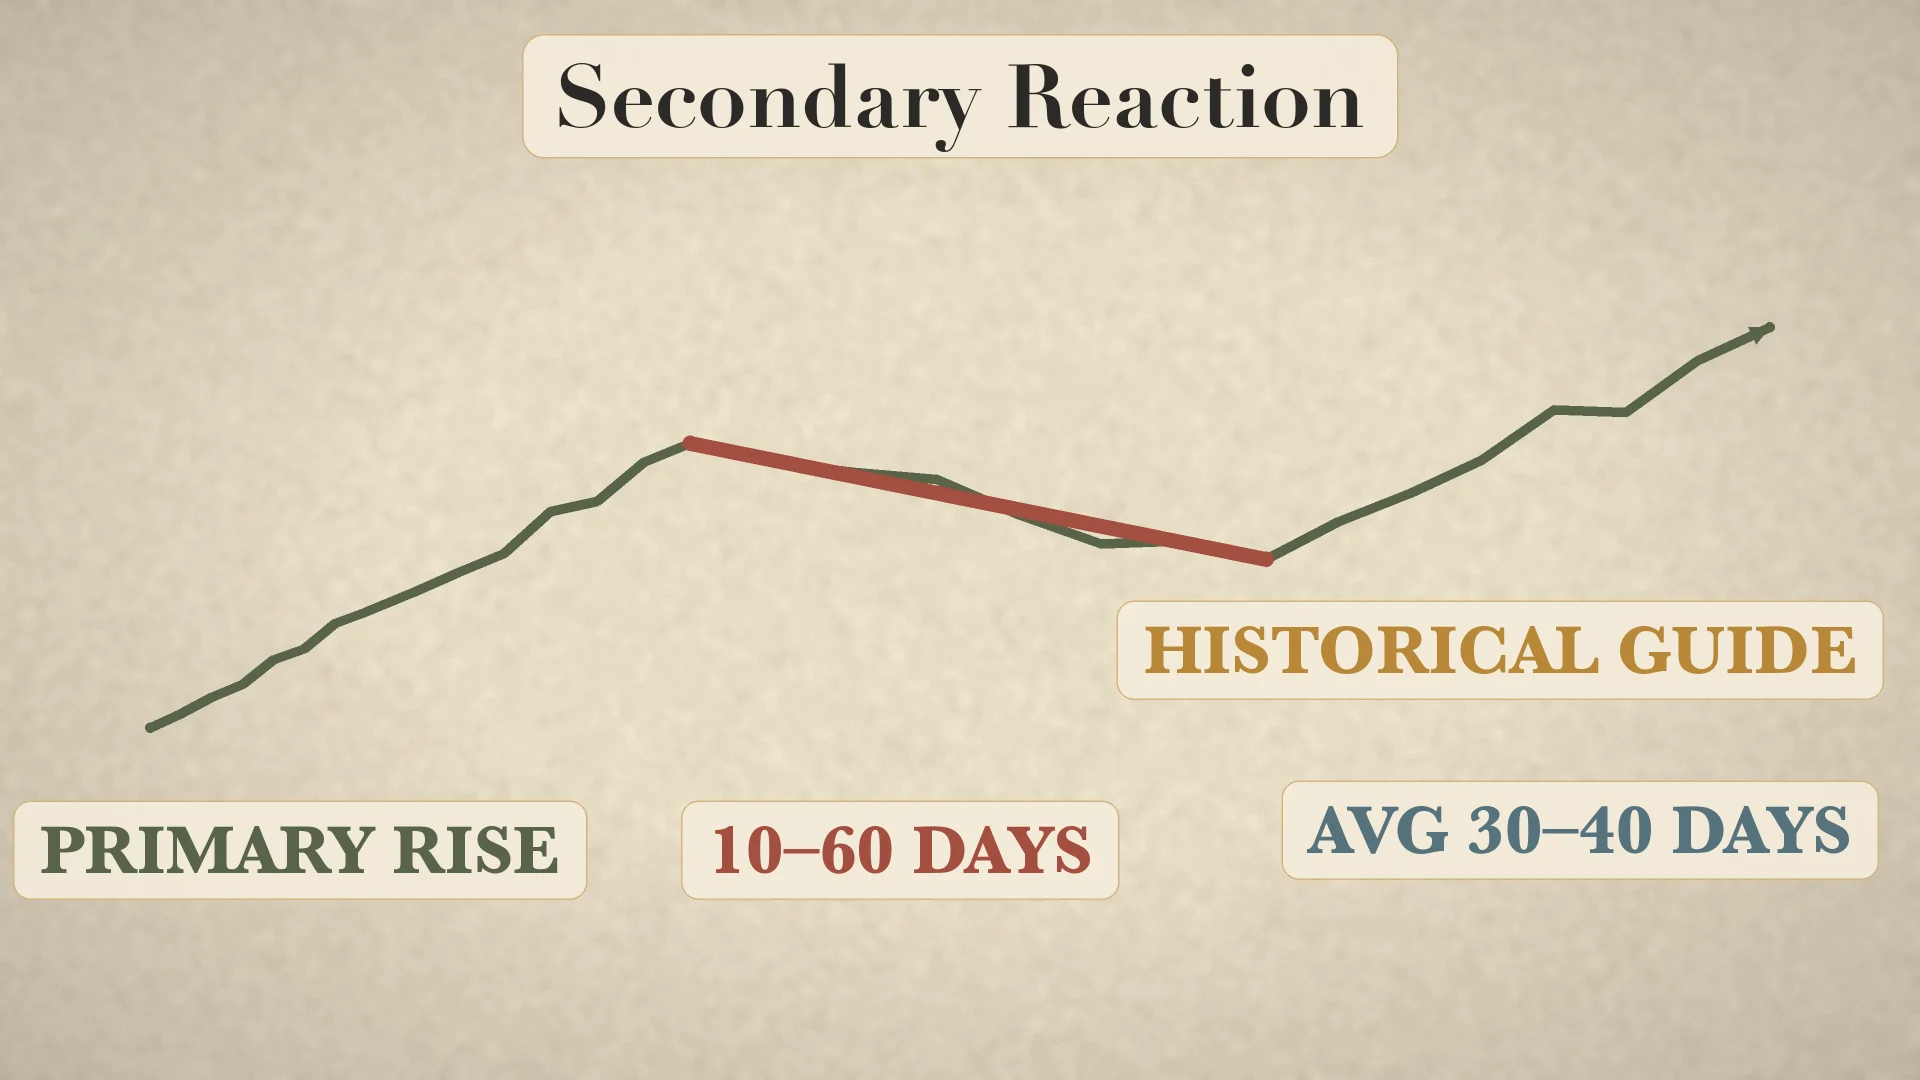
That lineage matters because it separates historical layers. Nelson described day-to-day movement, a secondary movement of 10–60 days that often averaged 30–40 days, and a main move of roughly four to six years. Those numbers report Nelson's 1903 observations. They are not universal timers and should not be used to reject a chart merely because a reaction lasts nine days or sixty-one.
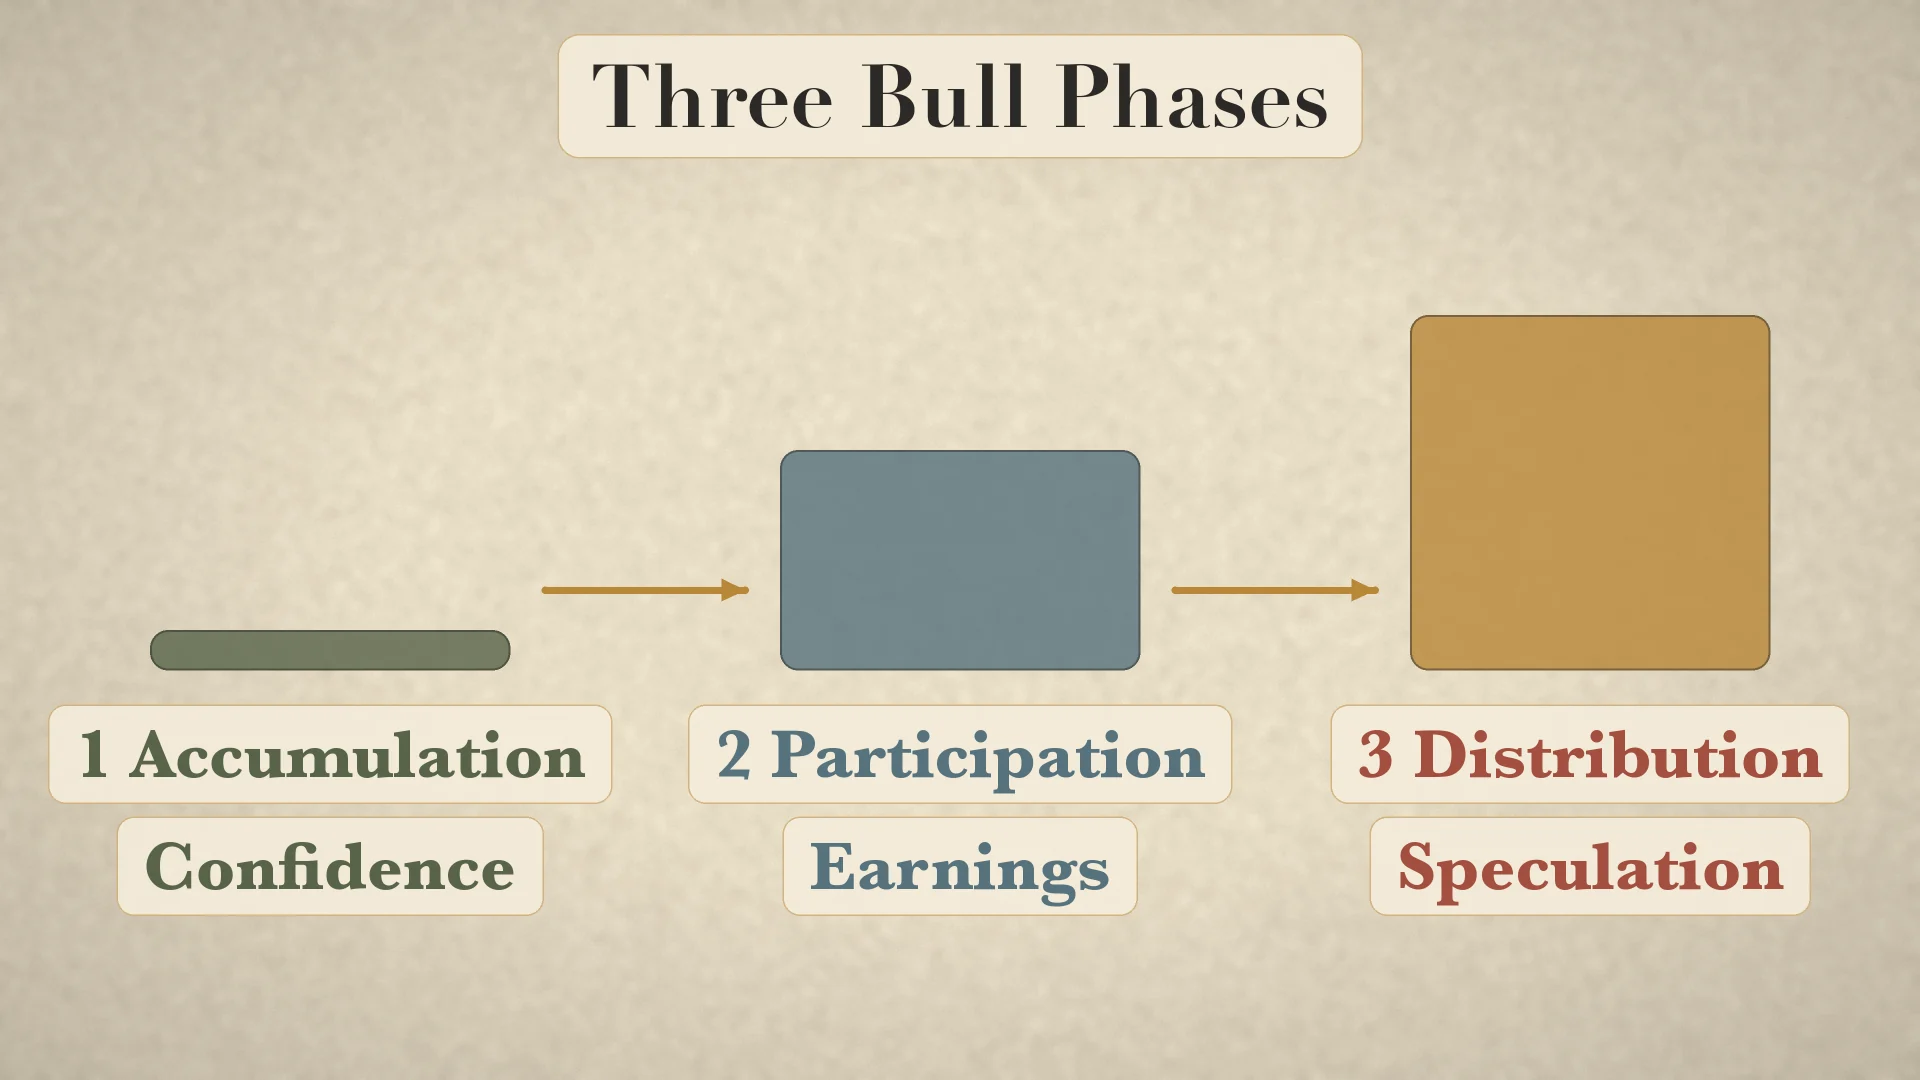
The familiar bull-market labels accumulation, public participation and distribution are useful modern teaching shorthand. Rhea's historically documented sequence was more specific: revival of confidence, prices responding to known earnings improvement, then rampant speculation and inflation. The safe lesson is that a primary move can pass through changing participation and expectations; it is not that Dow published a numbered three-stage trading formula.
Read the chart as tide, wave and ripple
Dow Theory asks the reader to hold three degrees of movement at once. The primary trend is the tide: the large direction. A secondary reaction is a wave moving against or within that tide. Minor daily fluctuations are ripples. A three-day decline can therefore be bearish as a ripple while remaining only a secondary reaction inside a primary bull trend. The metaphor prevents a common category error: treating every red bar as a change in the largest trend.
Turn the metaphor into explicit structure
- Choose significant closing-price peaks and troughs; admit that this selection requires judgement.
- Label the earlier peak
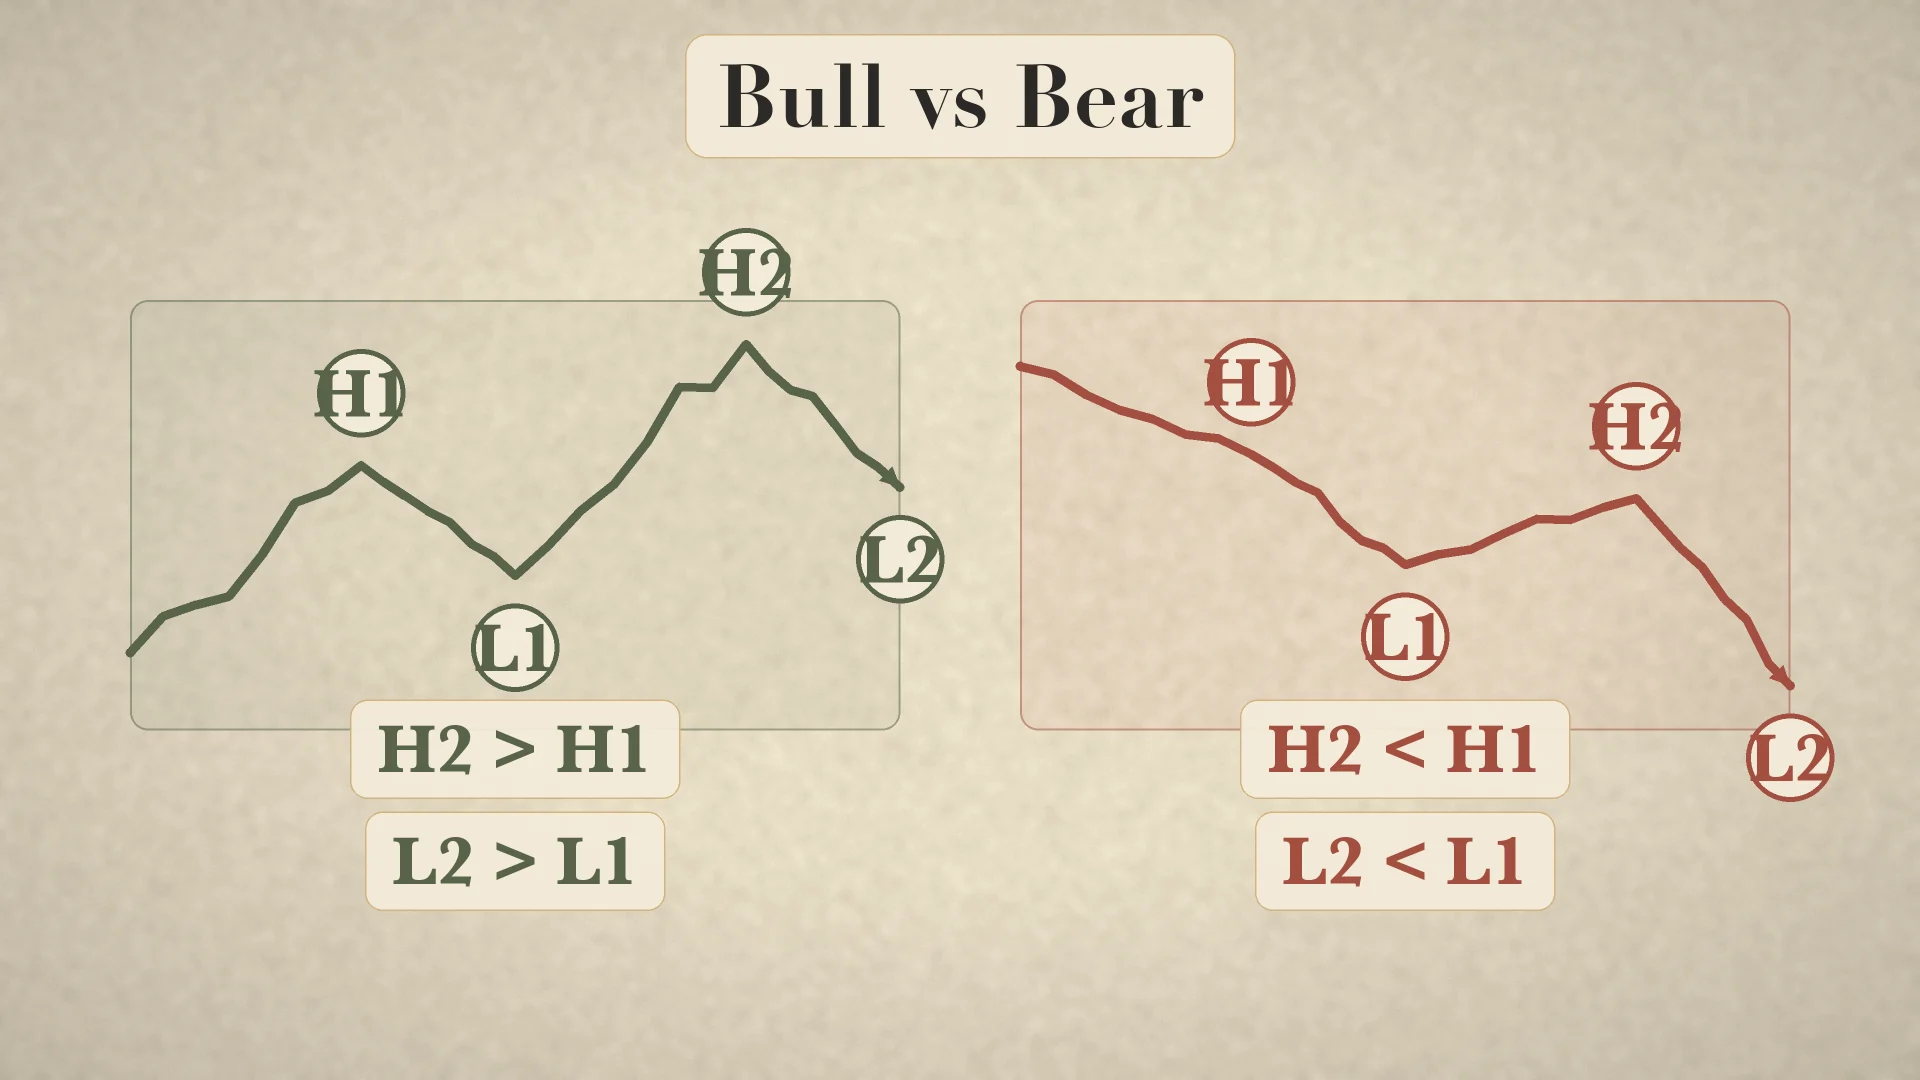
H1and later peakH2; label the earlier troughL1and later troughL2. - Bull structure requires both
H2 > H1andL2 > L1. - Bear structure requires both
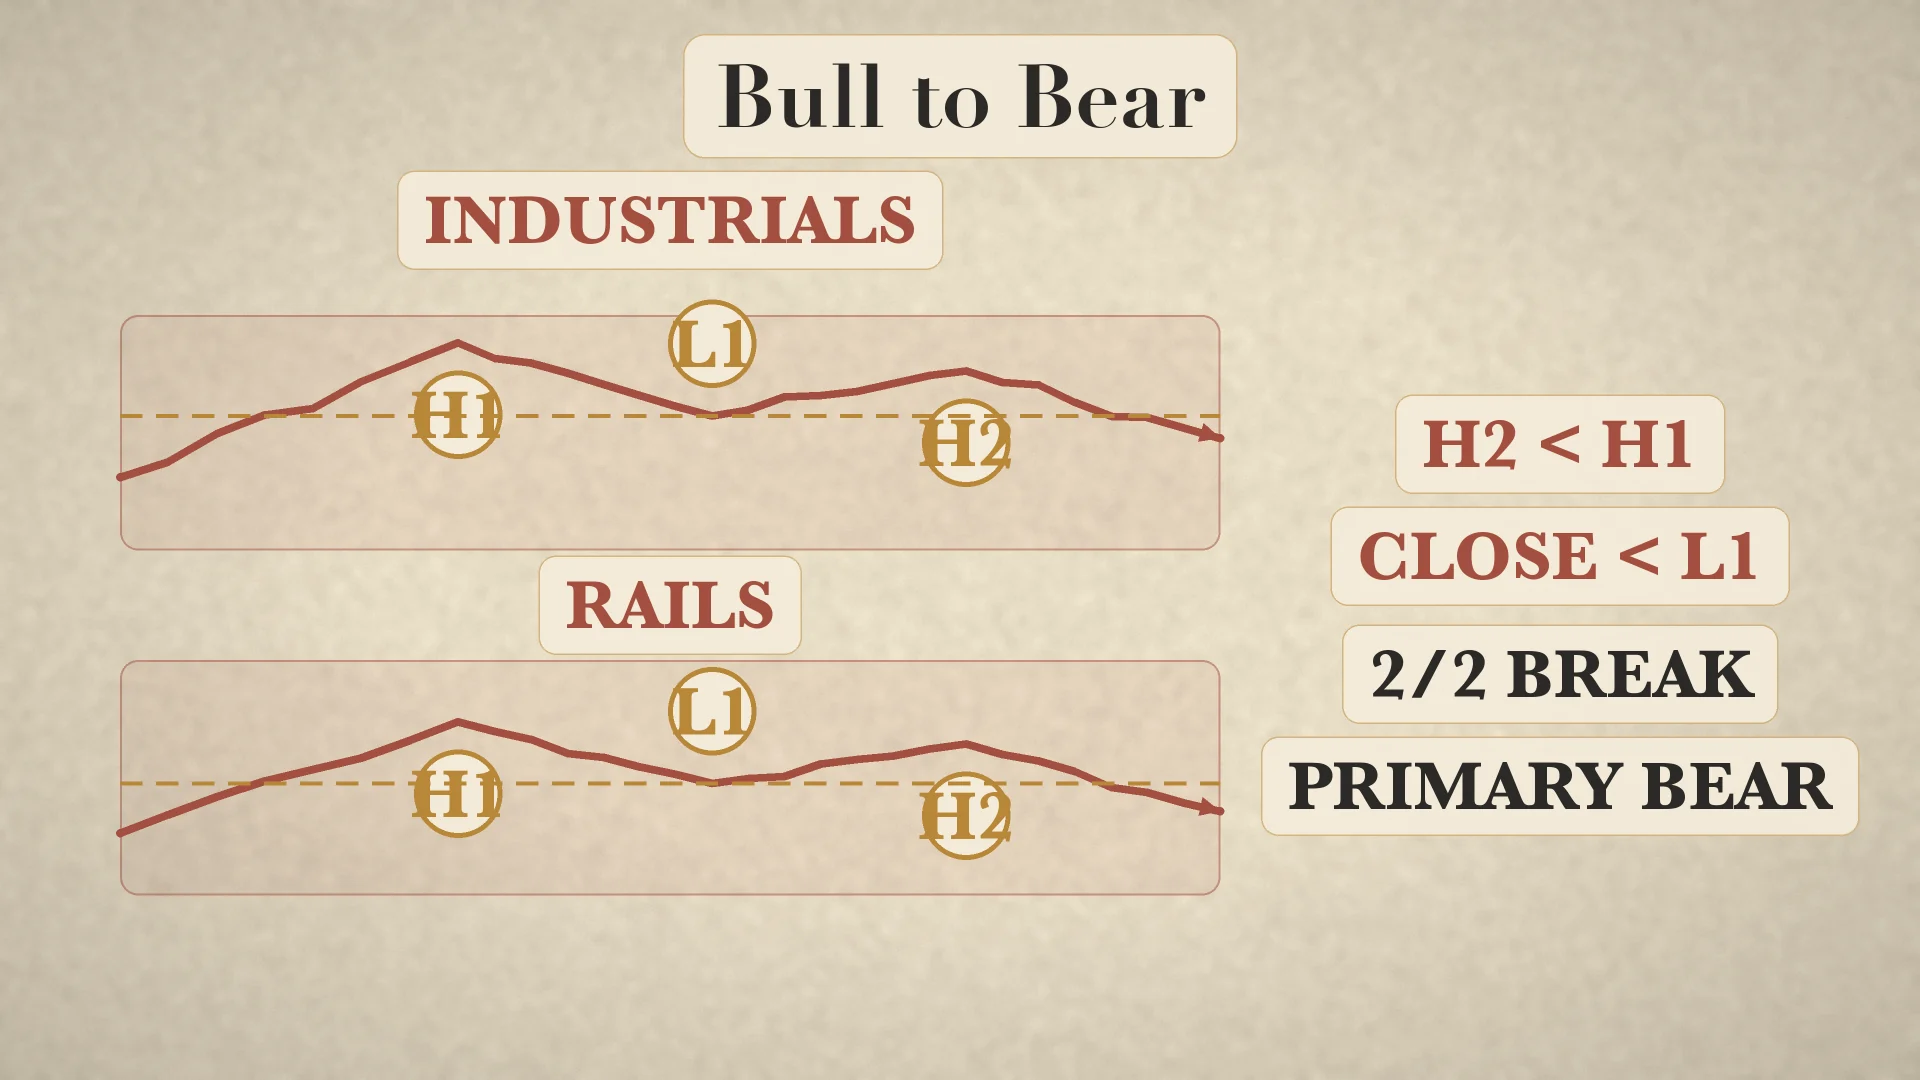
H2 < H1andL2 < L1. - If only one inequality changes, classify the chart as a warning or transition, not a completed primary reversal.
Example: an average peaks at 420, retreats to 380, rises to 445, and reacts to 405. Here H2=445 > H1=420 and L2=405 > L1=380, so its structure is bullish. If the next rally stops at 435, a lower high exists, but the prior significant low at 405 still holds. The lower high warns; it does not complete the bearish reversal.
Use market phases as descriptions, not entry buttons
The modern sequence accumulation → public participation → distribution can help narrate how a bull market's character changes. Accumulation describes early buying while broad confidence remains weak; public participation describes the wider response as improvement becomes visible; distribution describes late transfer amid optimism. Rhea's historical wording—revival of confidence, response to known earnings improvement, then rampant speculation and inflation—is more precise to his text.
The phase label should follow evidence rather than substitute for it. A reader cannot prove “accumulation” merely because price is low, or “distribution” merely because price is high. On a chart, first document peaks, troughs, confirmation and supporting volume; then use a phase word as a cautious summary. No phase provides a numeric entry, stop or duration in the source boundary.
Confirmation: one average warns, two averages decide
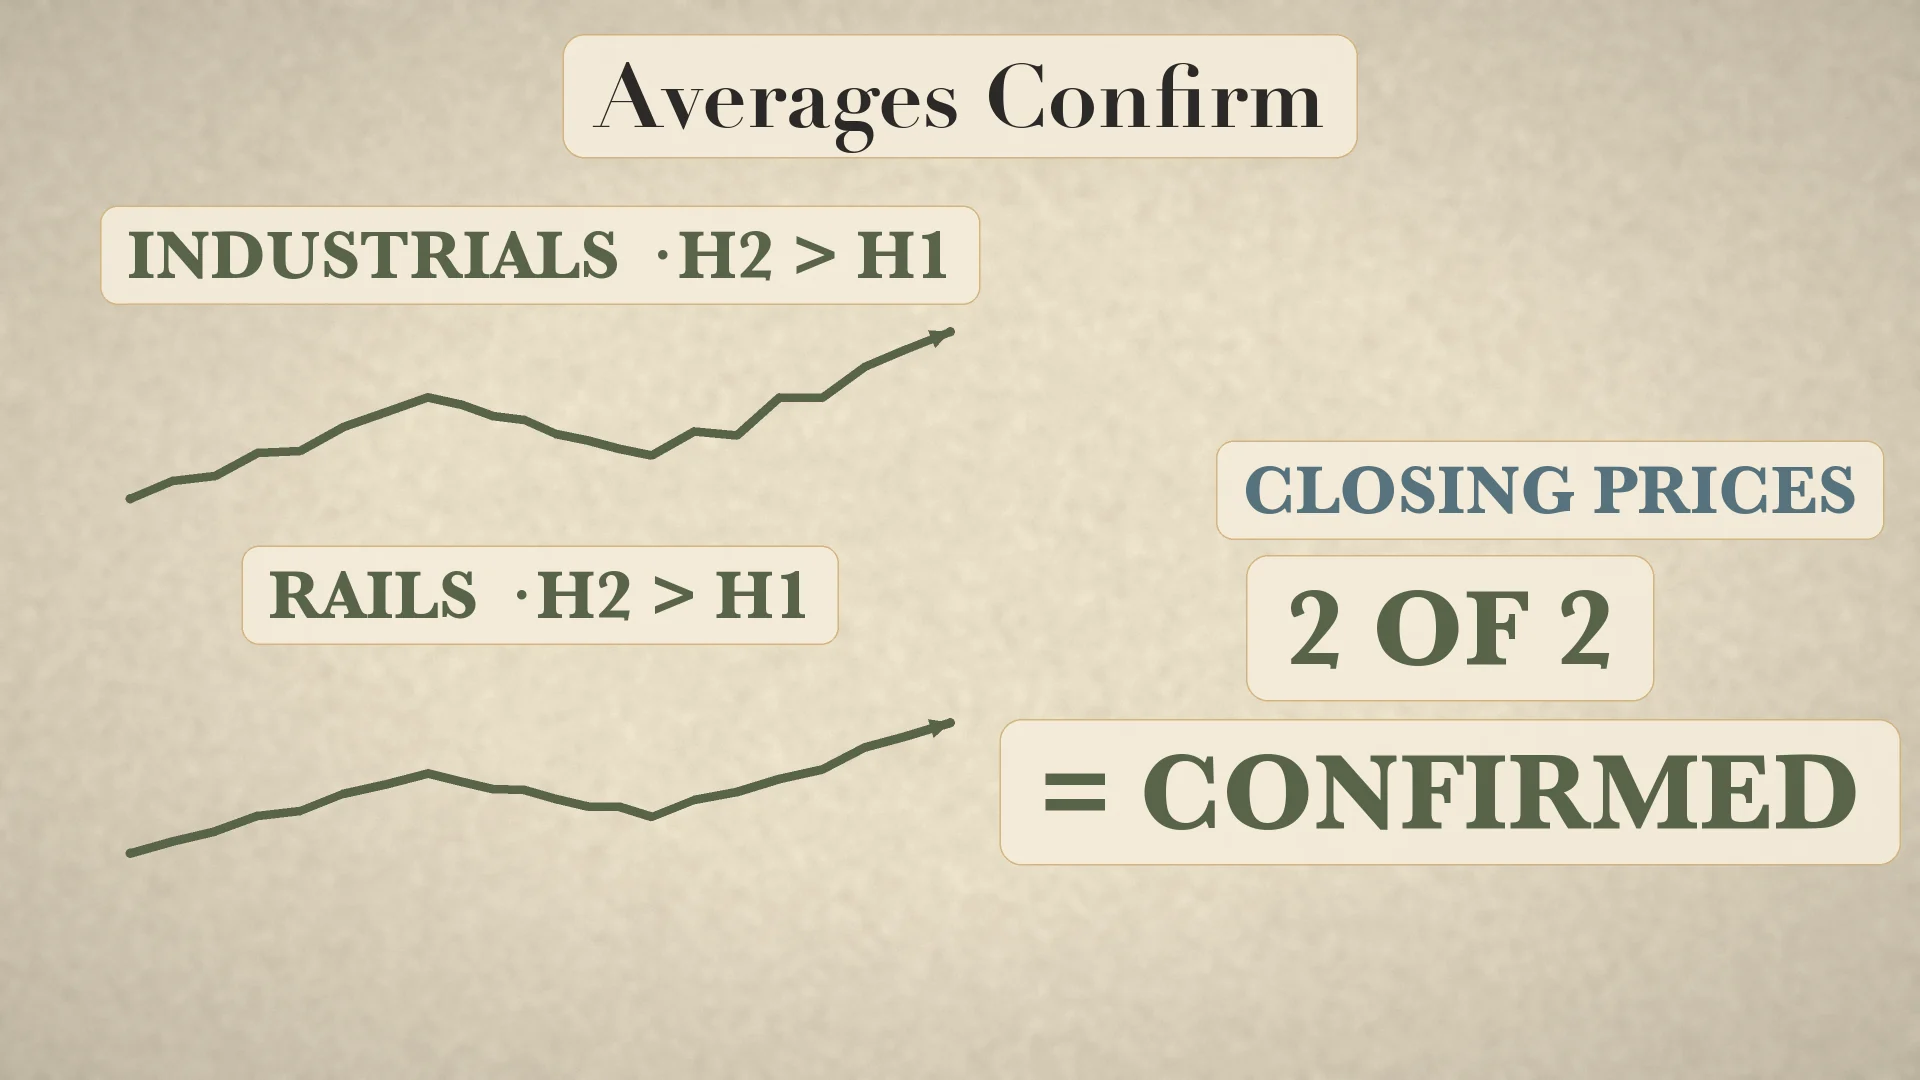
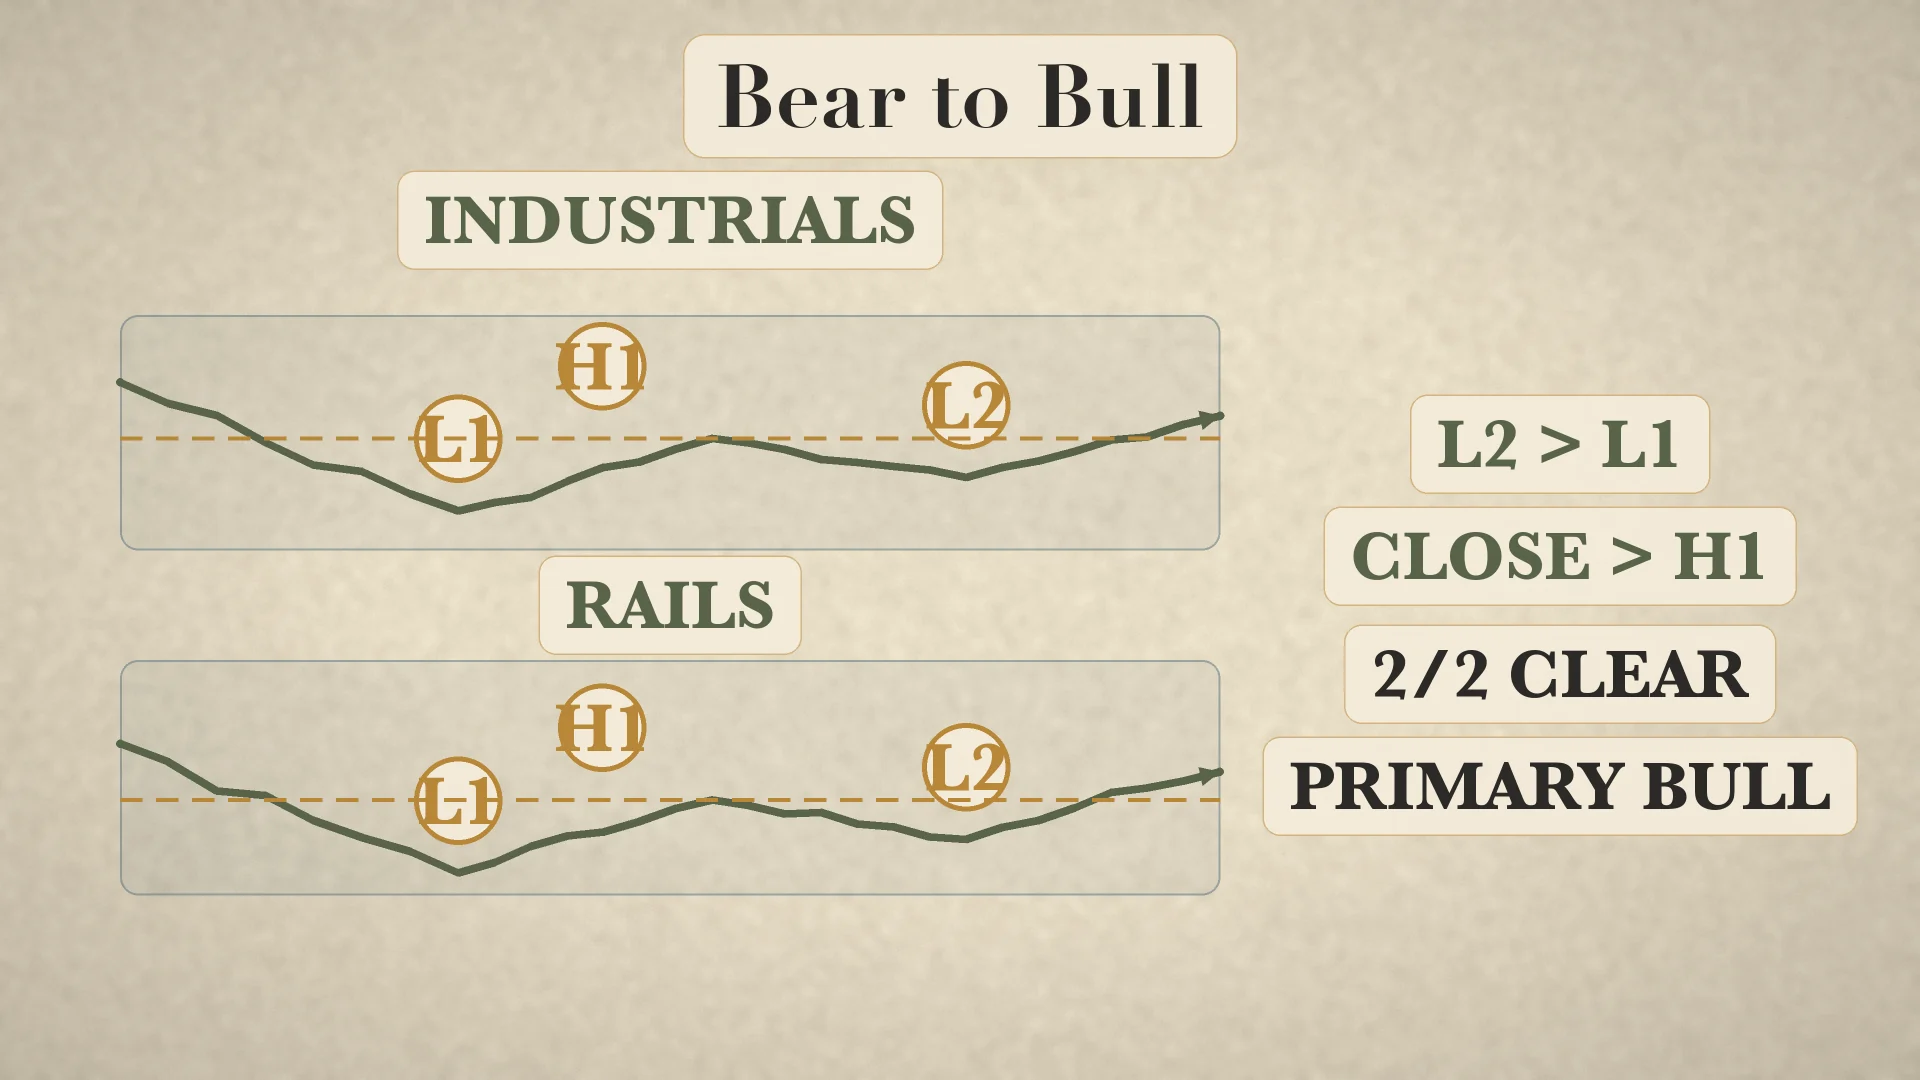
The primary signal comes from closing-price structure in both Industrials and Rails. For a bullish reversal after a bear move, first identify a higher reaction low, then require a close above the preceding significant secondary high in both averages. For a bearish reversal after a bull move, first identify a lower reaction high, then require a close below the preceding significant secondary low in both. The confirmations need not occur on the same day. [6]
Worked two-average example
- Industrials have a prior secondary high of 39,800 and Rails have one at 15,600.
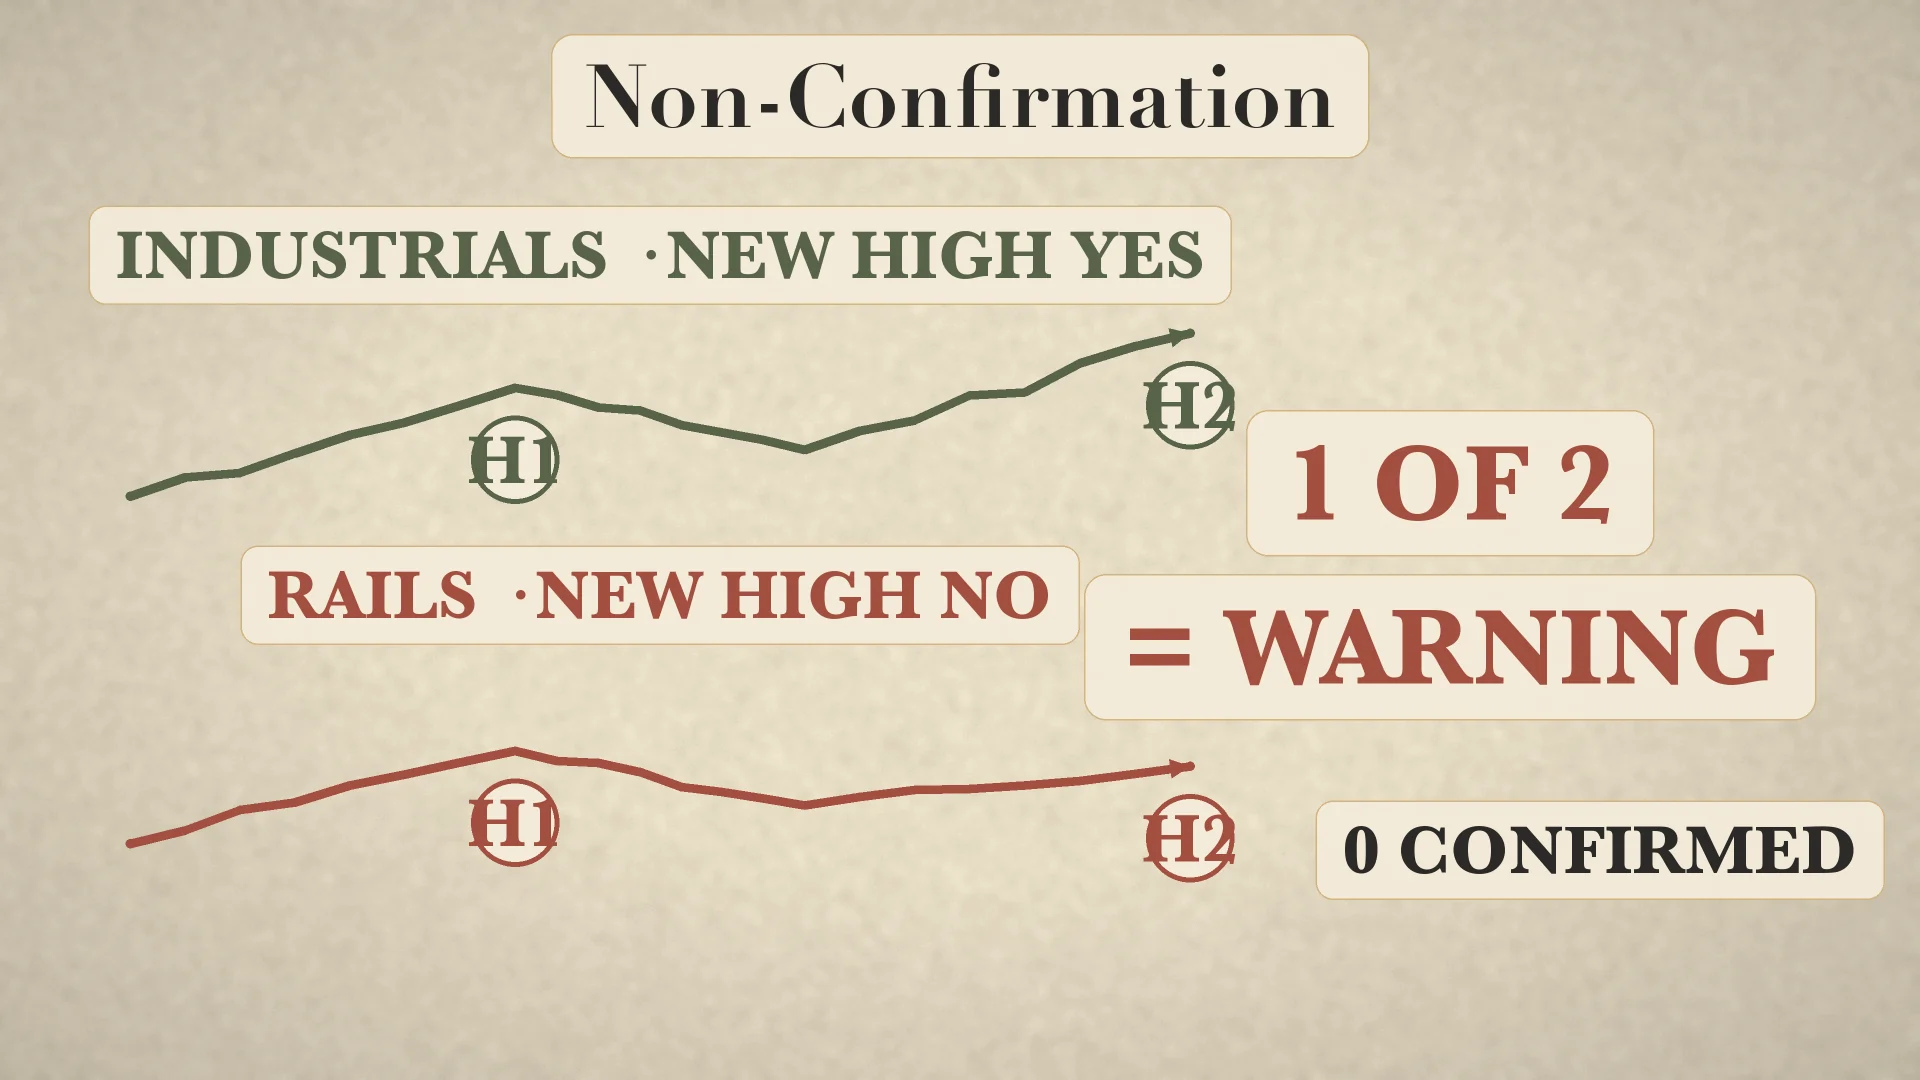
- Industrials close at 39,950 on Tuesday. That is one confirmed break, but only
1 of 2averages. - Rails close at 15,540 on Tuesday, still below their threshold. Record non-confirmation; do not promote the move to a primary bullish signal.
- Rails close at 15,640 on Friday while Industrials remain above their threshold. The dates differ, but both closing structures now confirm.
Reverse the logic for a bearish turn. Suppose Industrials form a lower reaction high and then close below 38,900, while Rails remain above their own 15,050 secondary low. That is a warning. The primary bearish label appears only if Rails also closes below 15,050. This discipline reduces the temptation to declare a reversal from the more dramatic-looking chart alone.
Mirror-check a full bearish reversal
- Industrials peak at 40,200, react to 38,900, and rally only to 39,700: the reaction high is lower.
- Rails peak at 15,900, react to 15,050, and rally only to 15,620: it also has a lower high.
- Industrials close at 38,850, below 38,900, but Rails close at 15,090: record a warning because Rails has not broken.
- Rails later close at 15,020 while Industrials remain below their broken level: both averages now satisfy the bearish structure.
- The signal is necessarily later than the 40,200 peak; confirmation trades speed for evidence.
Volume supports the reading; it does not replace it
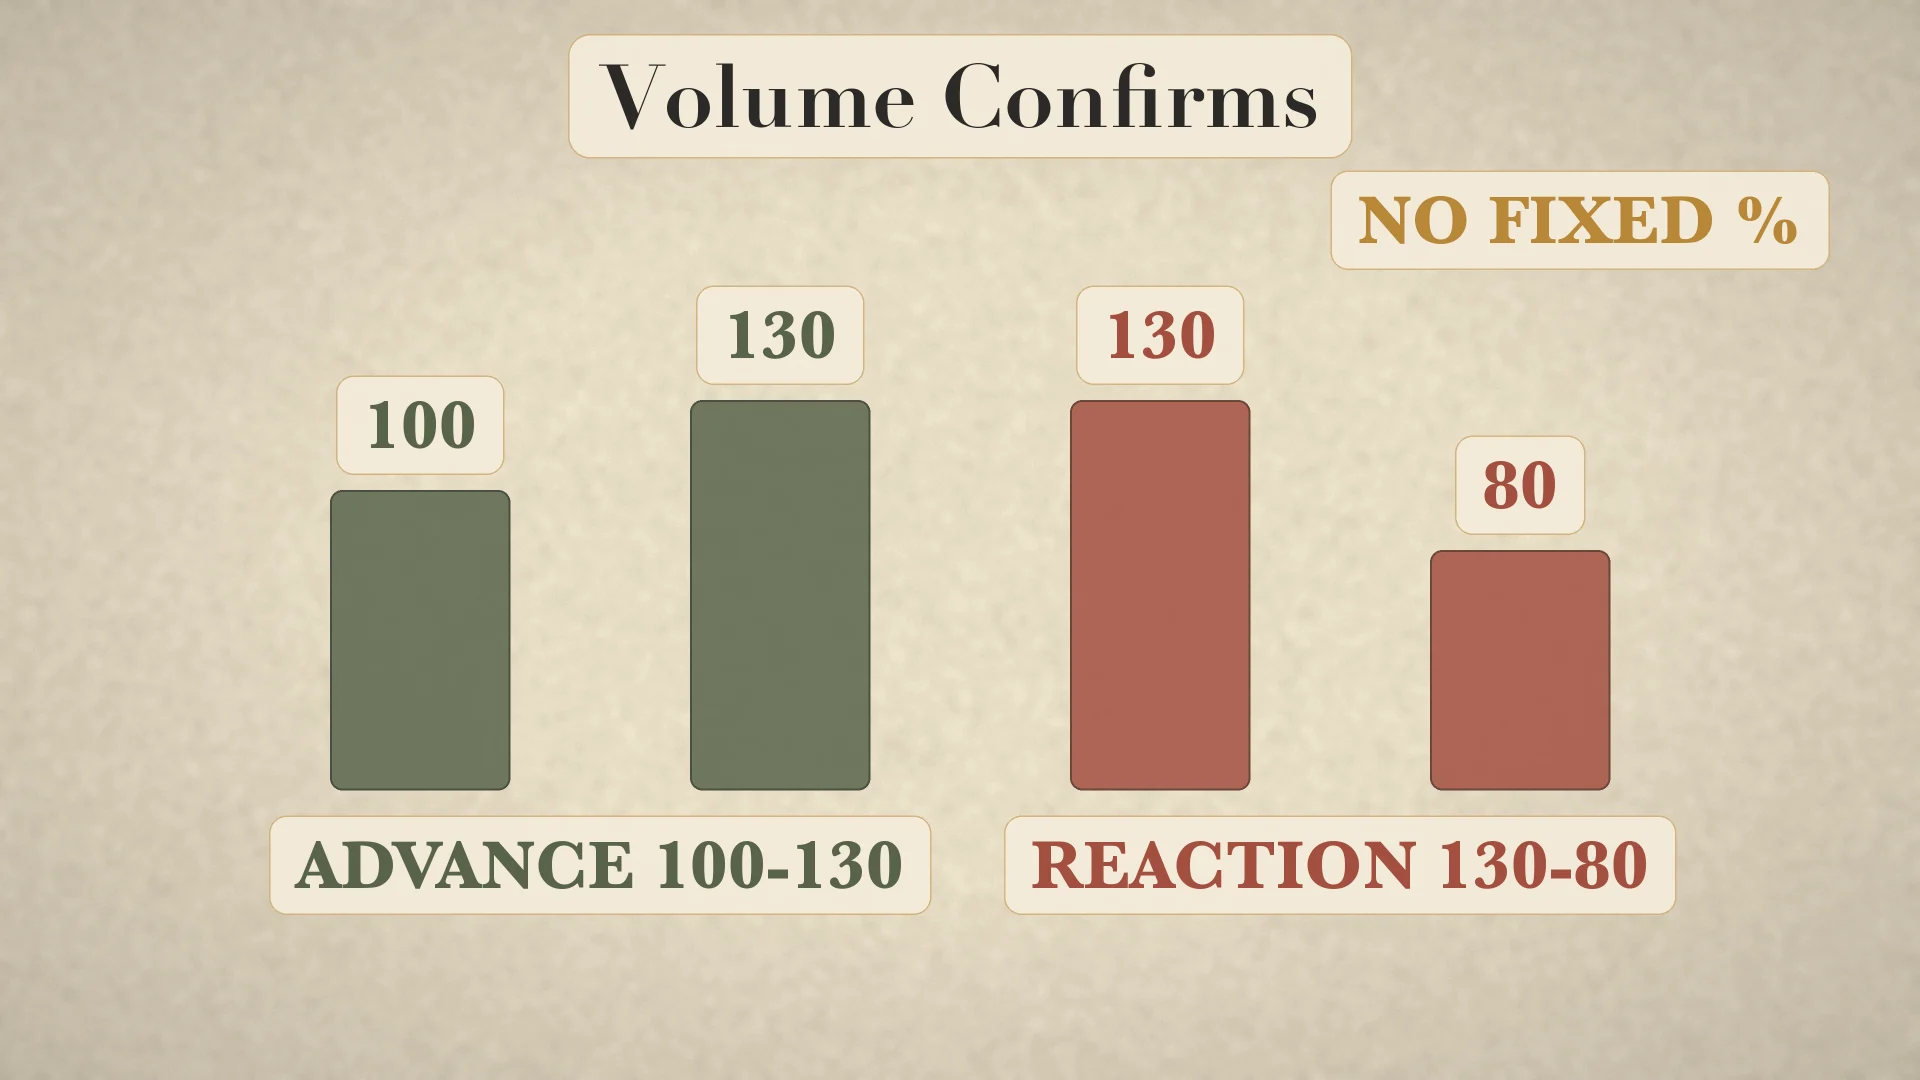
In the historical bull example, volume should expand with advances and contract on reactions. Nelson described the relationship and Rhea treated volume as a confirming statistic. Neither supplies an original fixed percentage threshold that turns volume into the main signal. The two-average closing-price structure stays primary. [4][6]
A simple indexed example makes the relationship visible. Let advance-day volume start at 100 and later rise to 130. Let reaction volume fall from 130 to 80. The comparisons are 130 > 100 on the advance and 80 < 130 on the reaction. This supports the bullish reading. It does not prove the trend, and a value of 129 instead of 130 would not invoke any historical pass/fail rule.
An educational chart workflow: entry, filter and stop logic
Use the framework as a sequence, not a prediction. First mark significant highs and lows on closing data for both averages. Second classify each average as higher-high/higher-low, lower-high/lower-low, or unresolved. Third wait for both to cross their relevant secondary levels. Fourth consult volume only as supporting context. This produces three states: confirmed, non-confirmed warning, or no structural change.
For an educational long example, the trend filter permits attention only after both averages confirm a bullish reversal. A chart entry might be studied at the confirming close or on a later pullback that holds above the broken level. An invalidation point can be defined below the significant reaction low that made the bullish structure possible. For a short example, mirror every inequality. These are ways to translate a historical framework into testable chart rules, not recommendations to trade an index or security.
The stop must follow the chosen structure, not an arbitrary money amount. If a hypothetical entry is 112 and the structurally significant low is 104, the chart risk is 8 points before costs and gaps. If 8 points is unacceptable, the educational conclusion is to reduce size or skip the setup—not to move the structural low. Dow Theory itself supplies no position-sizing formula, profit target or guarantee.
Keep a small evidence table beside the chart: each average's prior high, prior low, latest reaction high, latest reaction low, closing break status, and date. Add one separate volume note. This makes later review possible without redrawing the turning points to suit the outcome. If the two averages disagree, the correct table entry is unresolved; the framework does not require the analyst to manufacture a trade.
Common mistakes and honest limits
- Calling one pullback a primary reversal before a lower high and prior-low break exist.
- Accepting one average's breakout as confirmation instead of recording non-confirmation.
- Forcing both averages to confirm on the same day.
- Treating Nelson's 10–60 days and four-to-six years as timeless settings.
- Inventing a volume percentage threshold or making volume the primary trigger.
- Attributing the modern checklist and phase labels directly to Dow.
- Moving significant highs and lows after the fact to make a preferred story fit.
The largest limitation is judgement. Two careful readers may choose different significant peaks and troughs, particularly in choppy data. Signals can also lag because confirmation occurs only after price has crossed an established level in both averages. The method cannot identify today's live primary trend from this article, backtest profitability by itself, model slippage, or promise a return. Its value is disciplined description: it tells the analyst exactly what evidence is present and what evidence is still missing.
Teaching diagrams
Glossary
- Primary trend
- The large market direction—the tide.
- Secondary reaction
- A counter-trend wave within the primary move.
- Minor move
- Daily fluctuations—the ripples.
- Confirmation
- Both Industrials and Rails validate the same primary move.
- Non-confirmation
- Only one average reaches the confirming level; a warning, not a signal.
- Significant high or low
- A judgement-selected turning point used to define structure.
Frequently asked questions
Did Dow publish the modern Dow Theory checklist?
No. Later writers, especially Nelson, Hamilton and Rhea, organized Dow's editorials into the teachable framework.
Must the two averages confirm on the same day?
No. Both must confirm, but not necessarily on the same day.
Is volume the primary signal?
No. It supports the reading; the two-average closing-price structure is primary.
Does one pullback reverse a trend?
No. Look for a structural break confirmed by both averages.
Sources
- U.S. Congressional Record: Charles H. Dow biography — www.govinfo.gov
- The Wall Street Journal: 130 years of the Journal — s.wsj.net
- S&P Dow Jones Indices: 130 Years of Stewardship — The Evolution of The Dow — www.spglobal.com
- S. A. Nelson, The A B C of Stock Speculation (1903) — archive.org
- William Peter Hamilton, The Stock Market Barometer (1922) — archive.org
- StockCharts ChartSchool: Dow Theory — chartschool.stockcharts.com
Educational content only — not financial advice or a promise of performance.