A documented market setting—and a cautious origin story
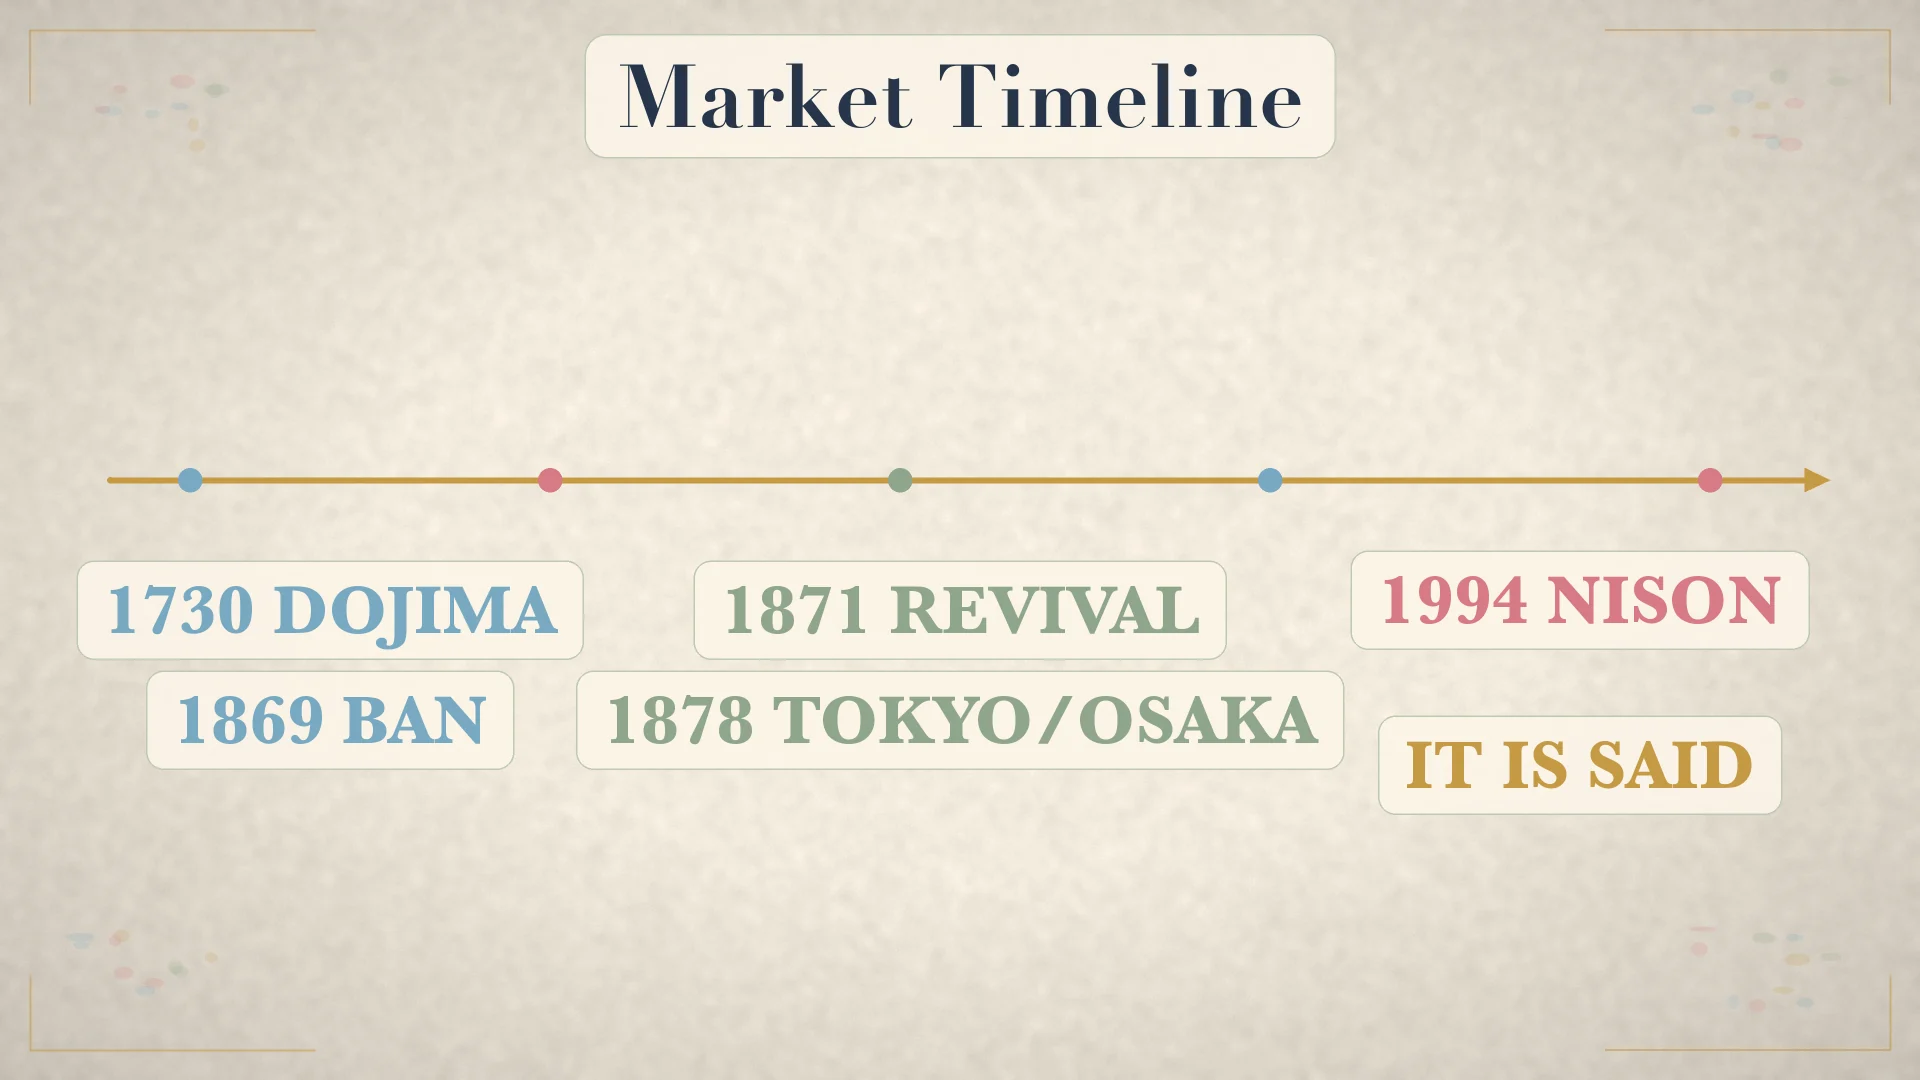
Japan's price-charting history sits inside a much older market history. The Tokugawa shogunate officially authorized the Dojima Rice Exchange in 1730. The Meiji government banned it in 1869, it revived in 1871, and its successor was abolished in 1939. The Tokyo Stock Exchange was established on 15 May 1878 and began trading on 1 June; Osaka's exchange was established in June 1878 and began trading in August. These dates document the market setting, not the invention date of every chart. [2][3]
Kagi is thought to have appeared when Japanese stock trading began in the 1870s, but the cited history does not identify a verified inventor. The Nippon Technical Analysts Association attributes a one-line new-price method in the Meiji era, 1868–1912, to Inoue Yosaburo; the common three-line form came later. Renko was also a Japanese method, sometimes called neri, training, or zigzag, and its name may derive from renga, meaning bricks. “Thought to” and “may” matter: legend should not be upgraded into fact. [1][4]
Steve Nison's Beyond Candlesticks, published by John Wiley & Sons on 13 December 1994, presented Three-Line Break, Renko and Kagi to Western readers. It remains the shared rule source here. The larger rice-market lineage is real, but this guide does not claim that a named Dojima trader invented all three methods. [1]
What “time-free” really means
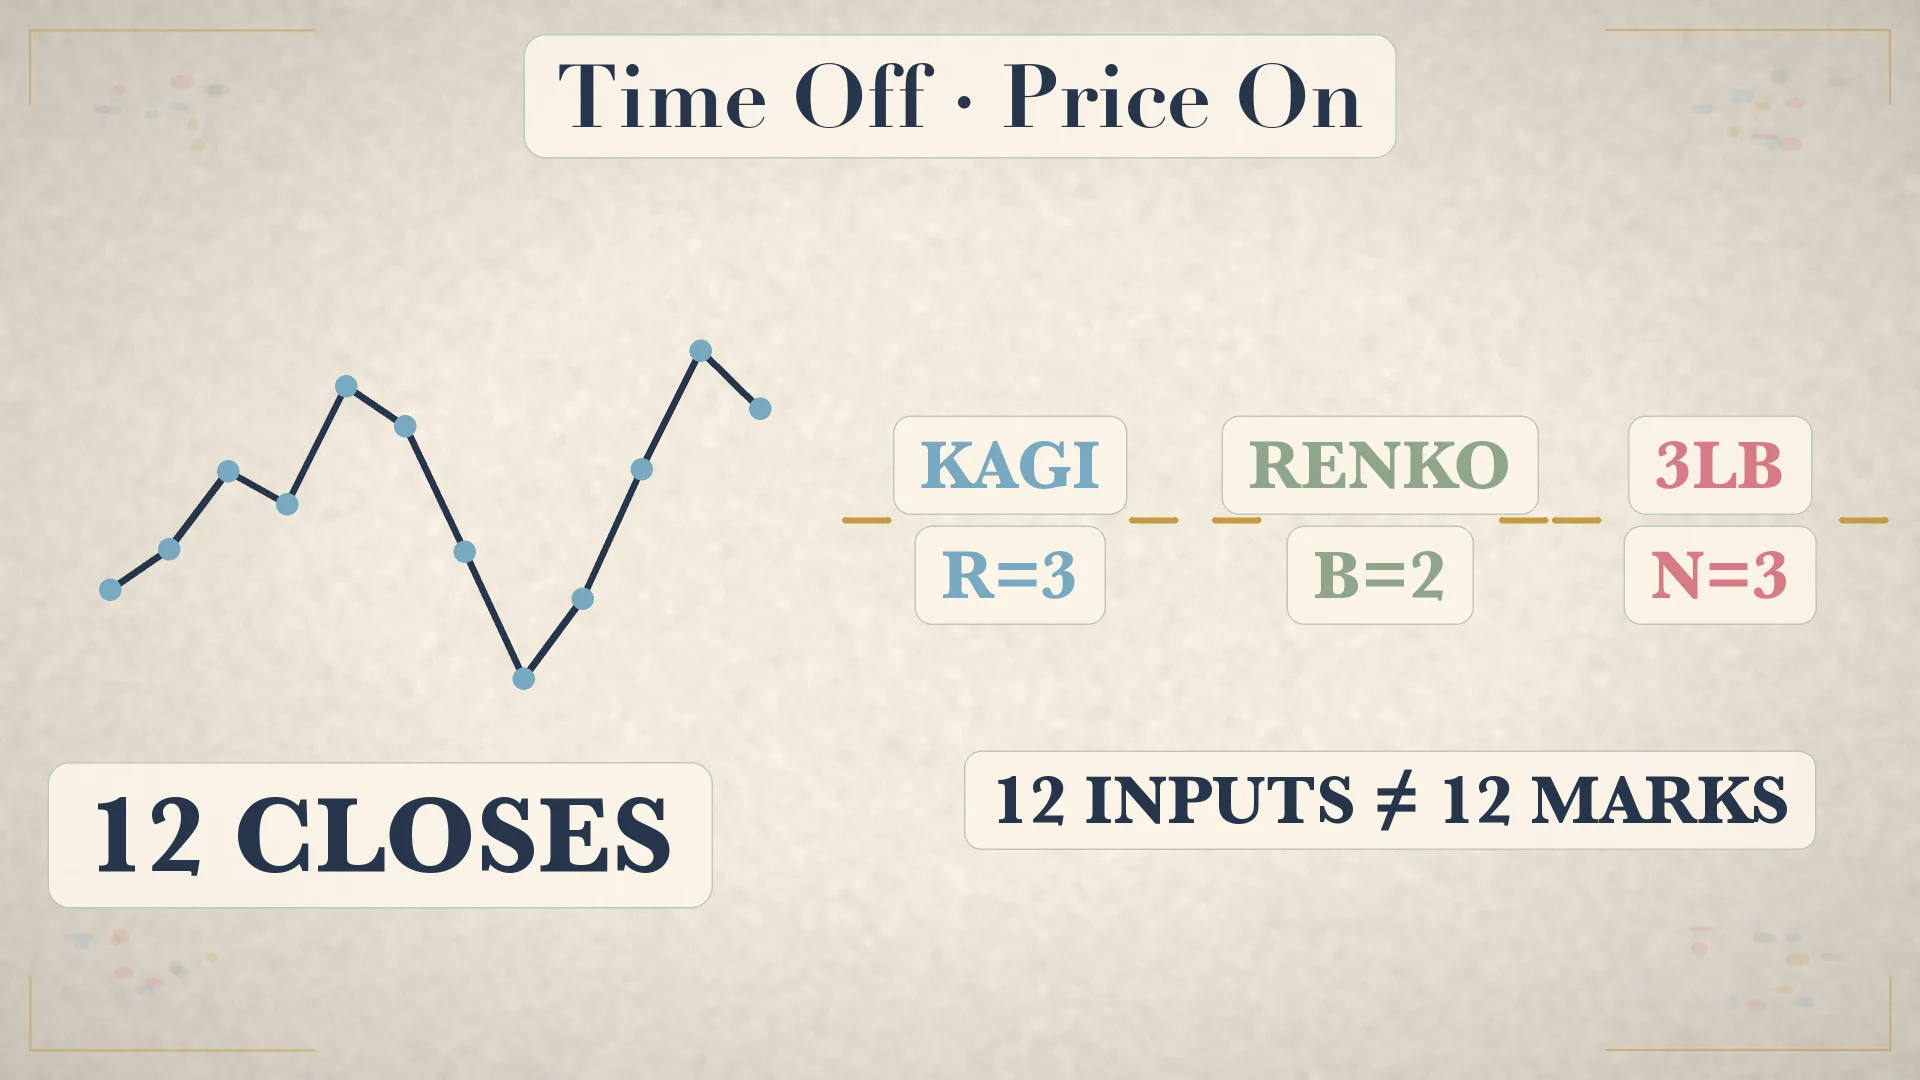
Kagi, Renko and Three-Line Break are non-linear-time price charts. Time still passes and source bars still arrive, but elapsed time alone does not force a mark. A line or brick appears only after price satisfies the method's threshold. Twelve daily closes may therefore create twelve marks, three marks, or none. The chart compresses inactivity and emphasizes threshold crossings.
That compression is a trade-off, not magic noise removal. The display discards elapsed-time spacing, volume and some path information. Depending on the implementation it can also hide the exact intrabar sequence that produced a threshold. A smoother-looking chart is not necessarily more predictable; it is simply answering a narrower question: has price moved far enough, by this rule, to draw something new? [1][5]
Before comparing results, record the source timeframe, whether closes or highs/lows are used, starting anchor, fixed or adaptive threshold, tick rounding and platform. Change any one of these and two apparently identical “Renko” or “Kagi” charts may differ. Reproducibility starts with settings, not screenshots.
Kagi: extend on new extremes, reverse by R
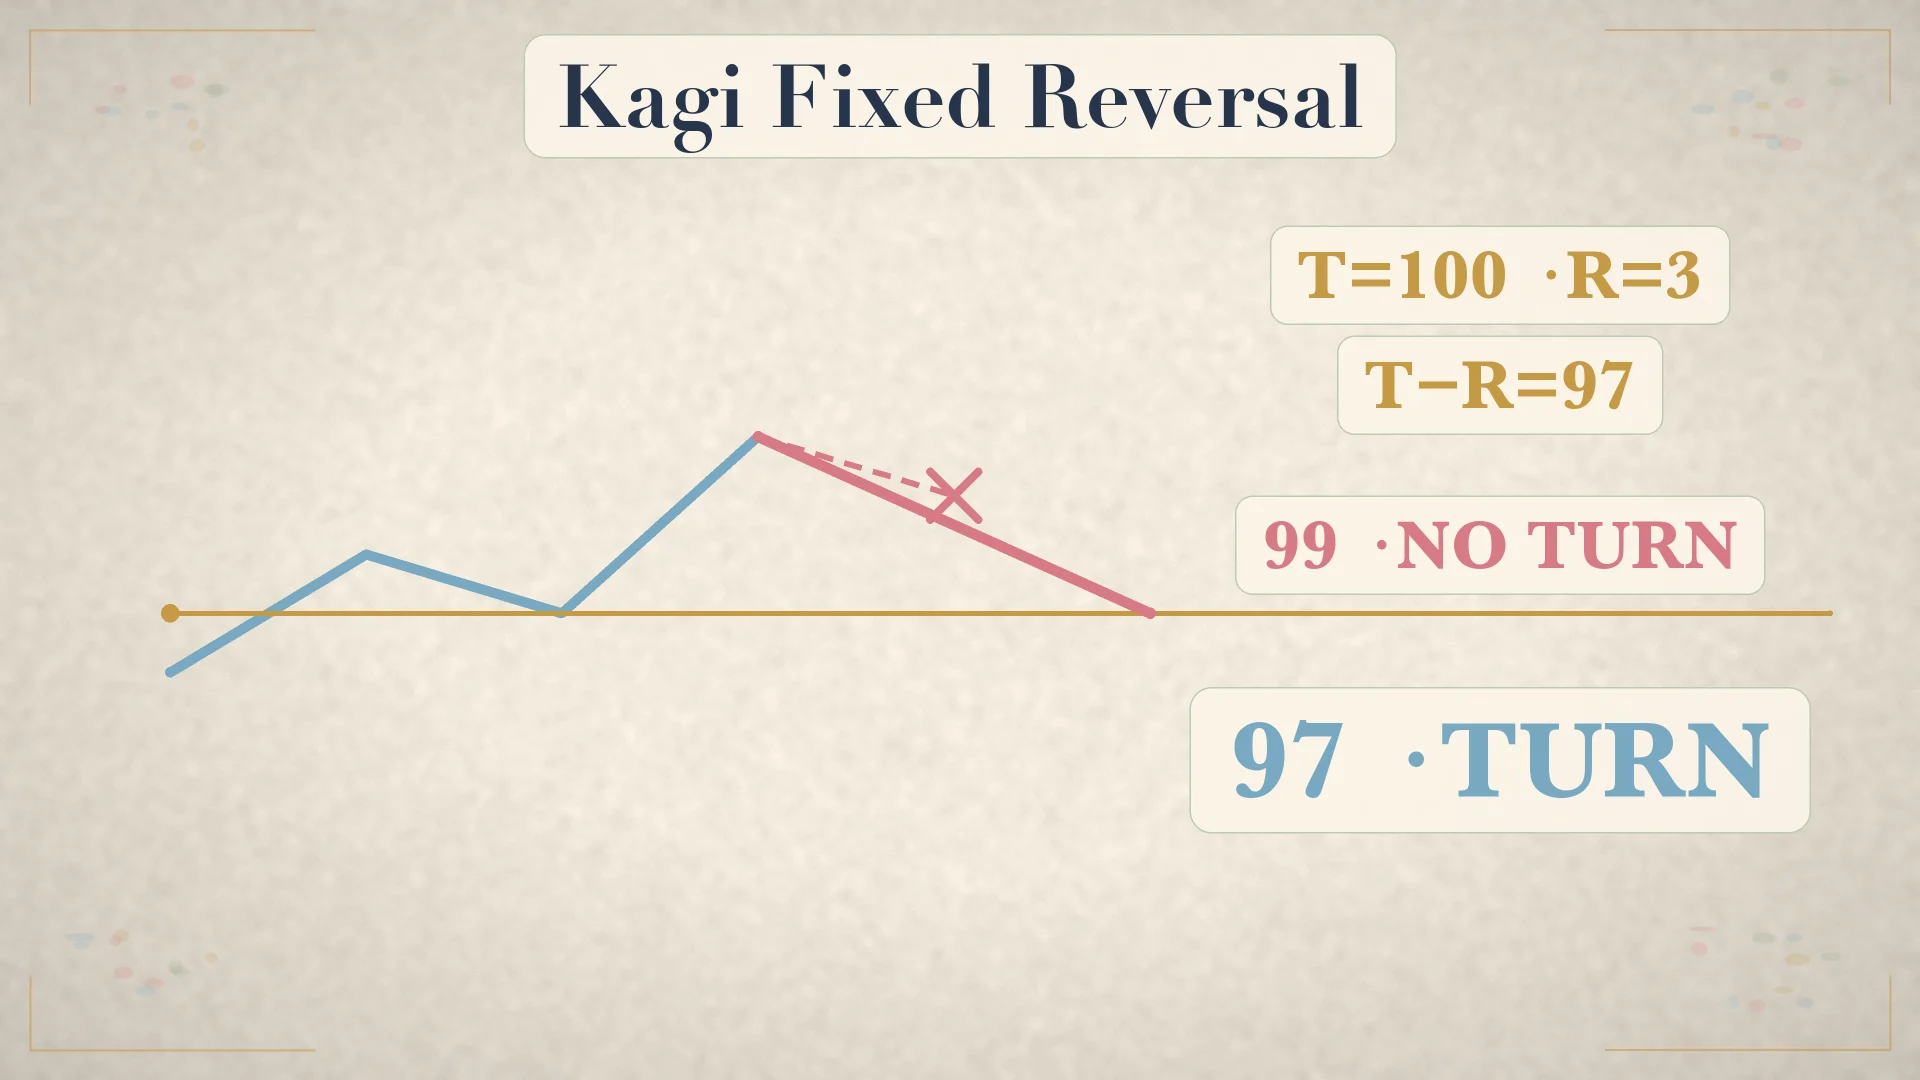
Kagi normally uses closes. Choose a reversal amount R in points or as a percentage. Let the current rising tip be T. A lower close reverses the line only when it reaches T−R; smaller declines draw no reversal. From a falling tip, an opposite close reverses only when it reaches T+R. In the current direction the line extends only on a new extreme; otherwise nothing is drawn. [1]
Worked fixed-reversal sequence
- Start with a rising Kagi tip at
T=100and fixedR=3. - The falling reversal threshold is
100−3=97. - A close at 99 is only 1 point down: no turn.
- A close at 98 is 2 points down: still no turn.
- A close at 97 reaches the threshold: draw the horizontal turn and a falling vertical line.
- If that falling tip later reaches 94, the next rising threshold is
94+3=97.
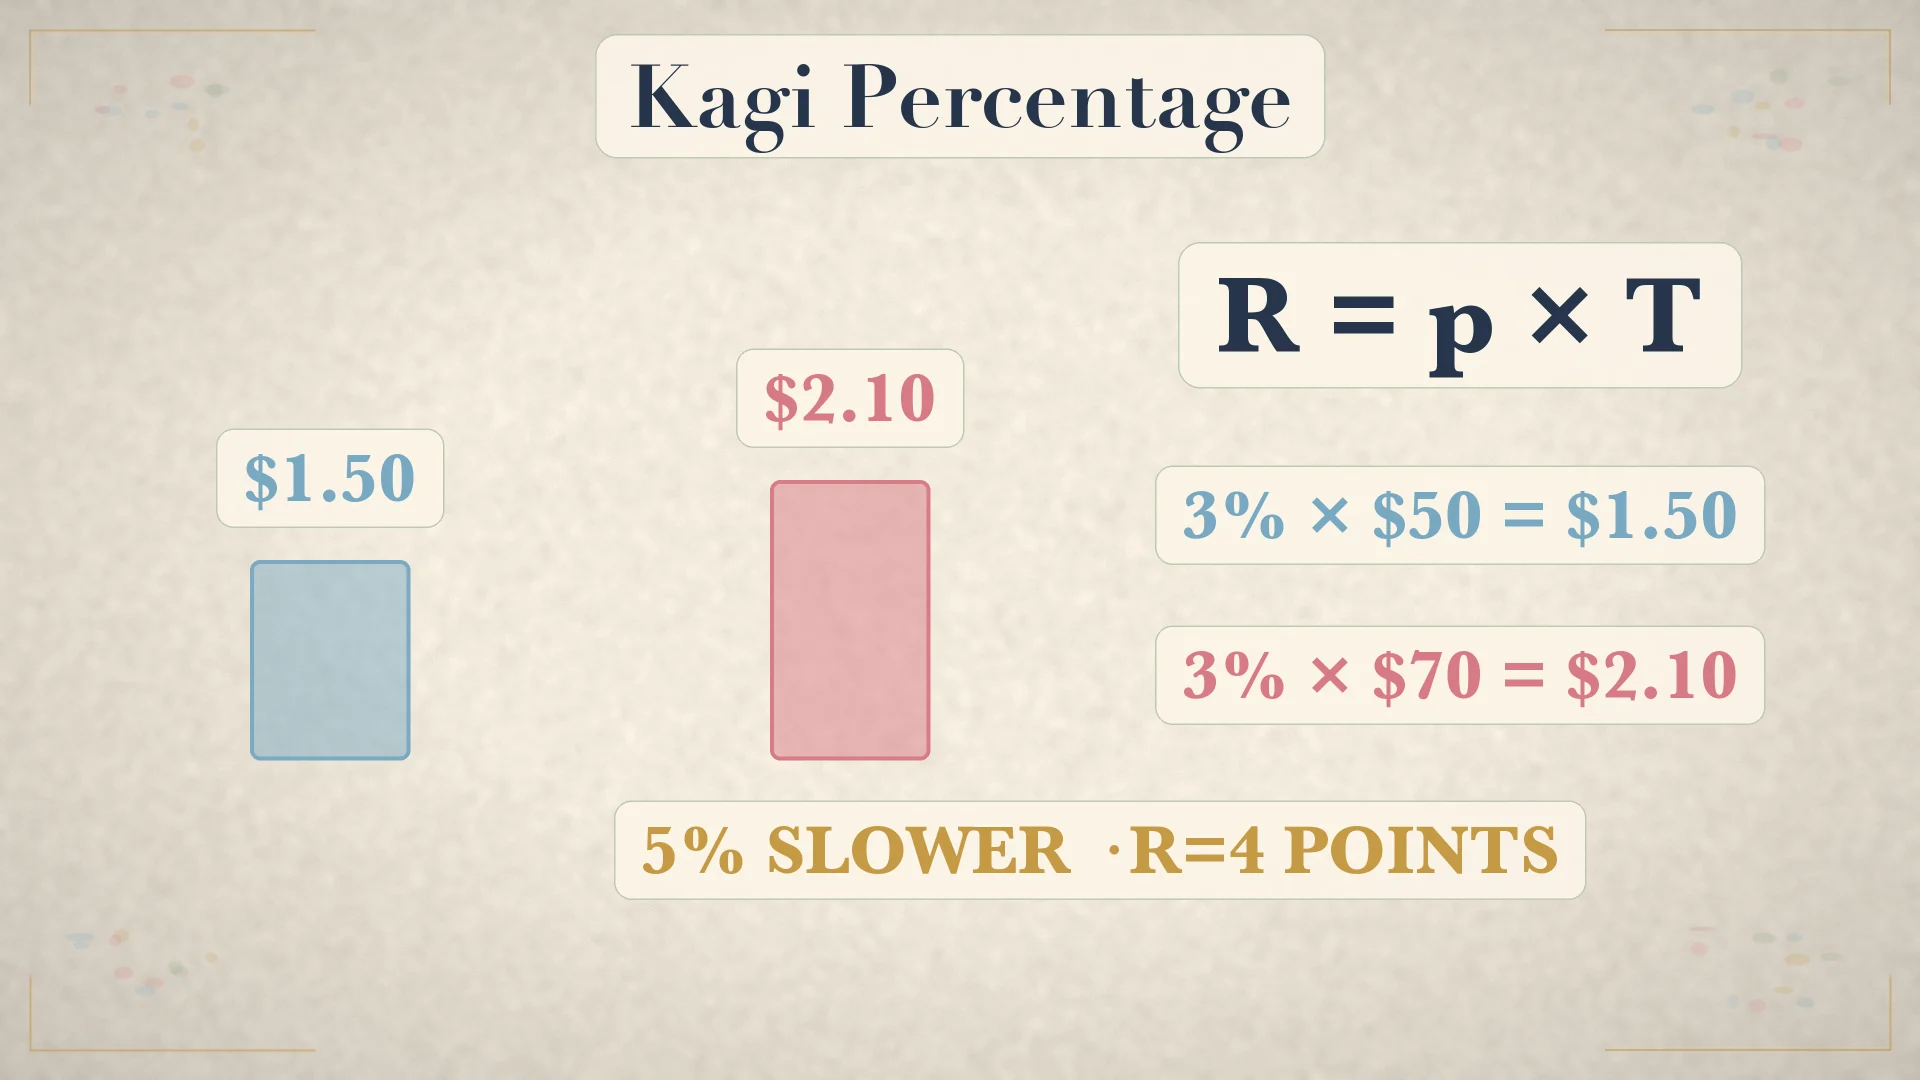
Percentage Kagi changes the absolute threshold with price: R_t=p×T. At 3%, a $50 tip gives $50×0.03=$1.50; a $70 tip gives $70×0.03=$2.10. Nison reported 3% as a general stock setting and 5% as popular for longer-term traders, while a separate construction example used four points. These are historical working settings, not universal optima.
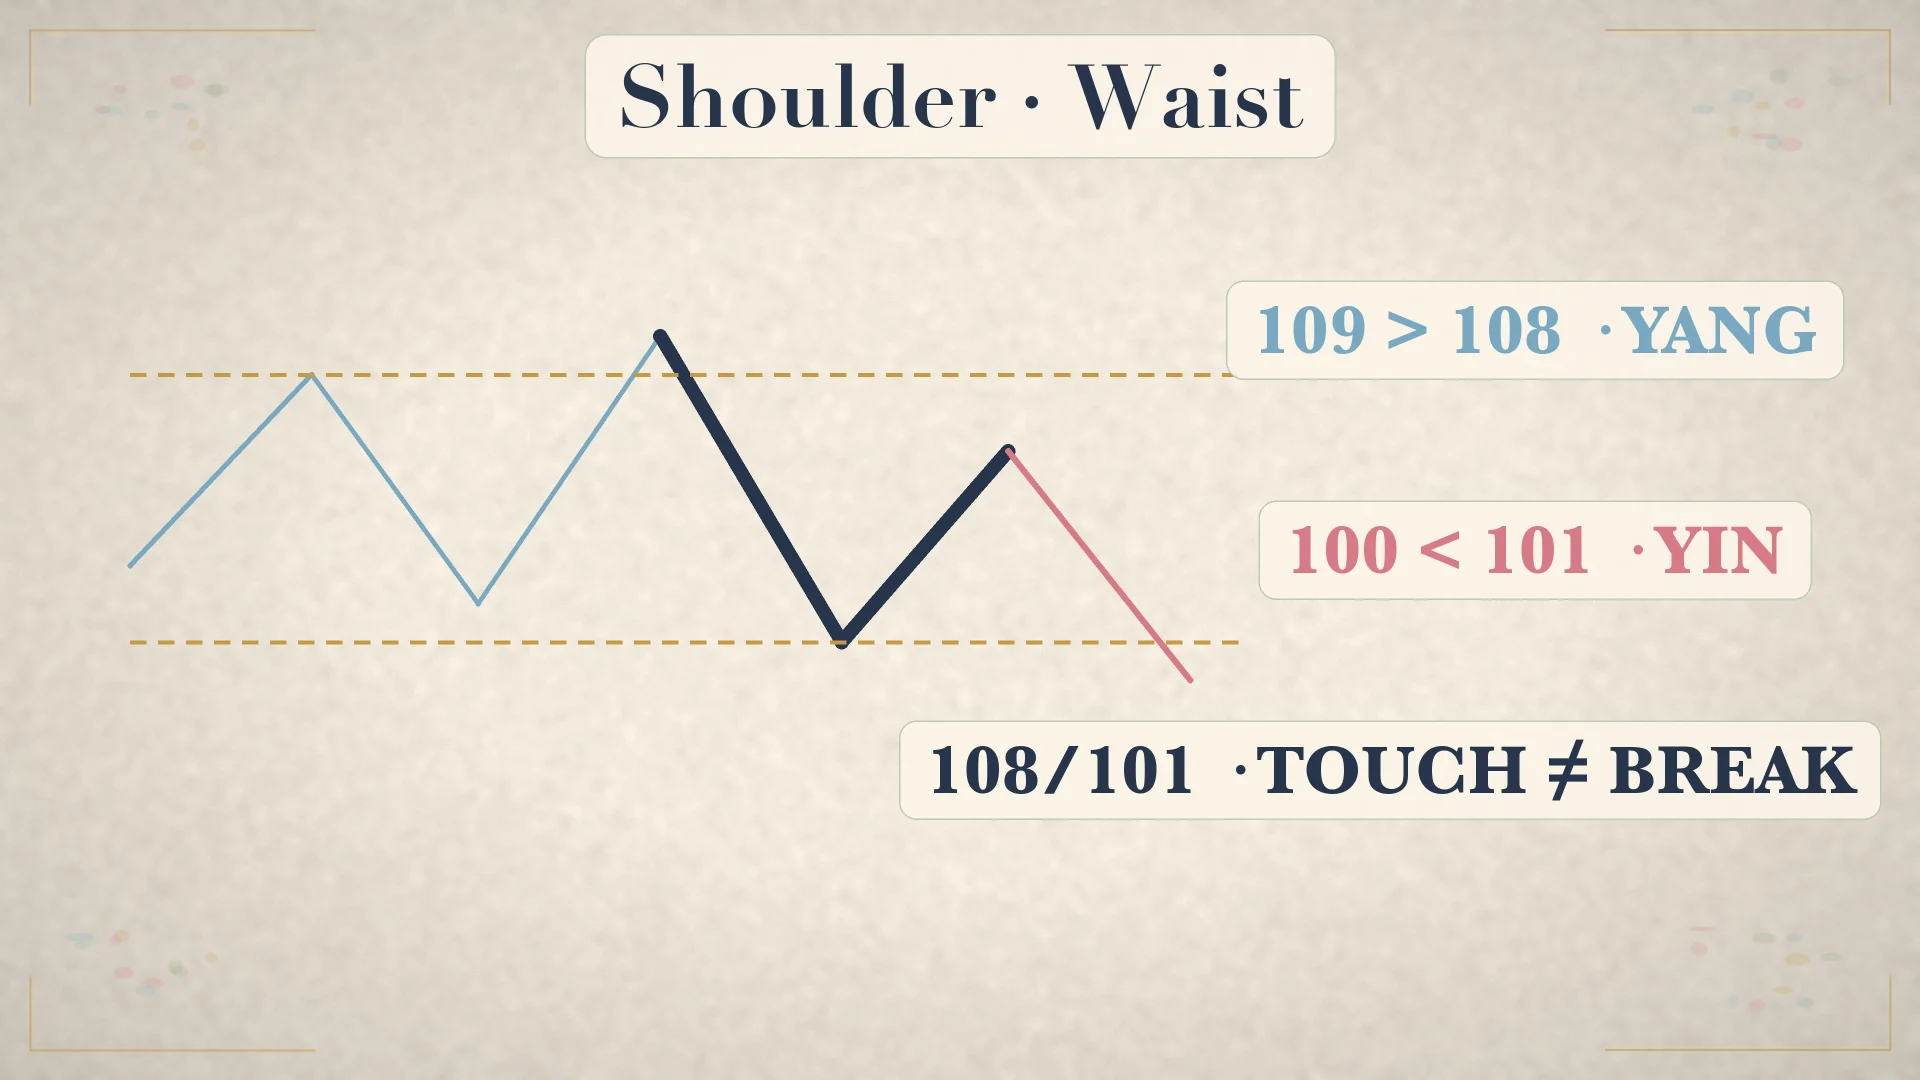
Line weight adds another state. A thin yin line becomes thick yang only when price exceeds the prior shoulder high. Thick yang becomes thin yin only when price breaks below the prior waist low. In a strict-break example, touching a shoulder at 108 is insufficient; closing at 109 changes to yang. Touching a waist at 101 is insufficient; closing at 100 changes to yin.
Renko: equal bricks, one-brick continuation, two-brick reversal
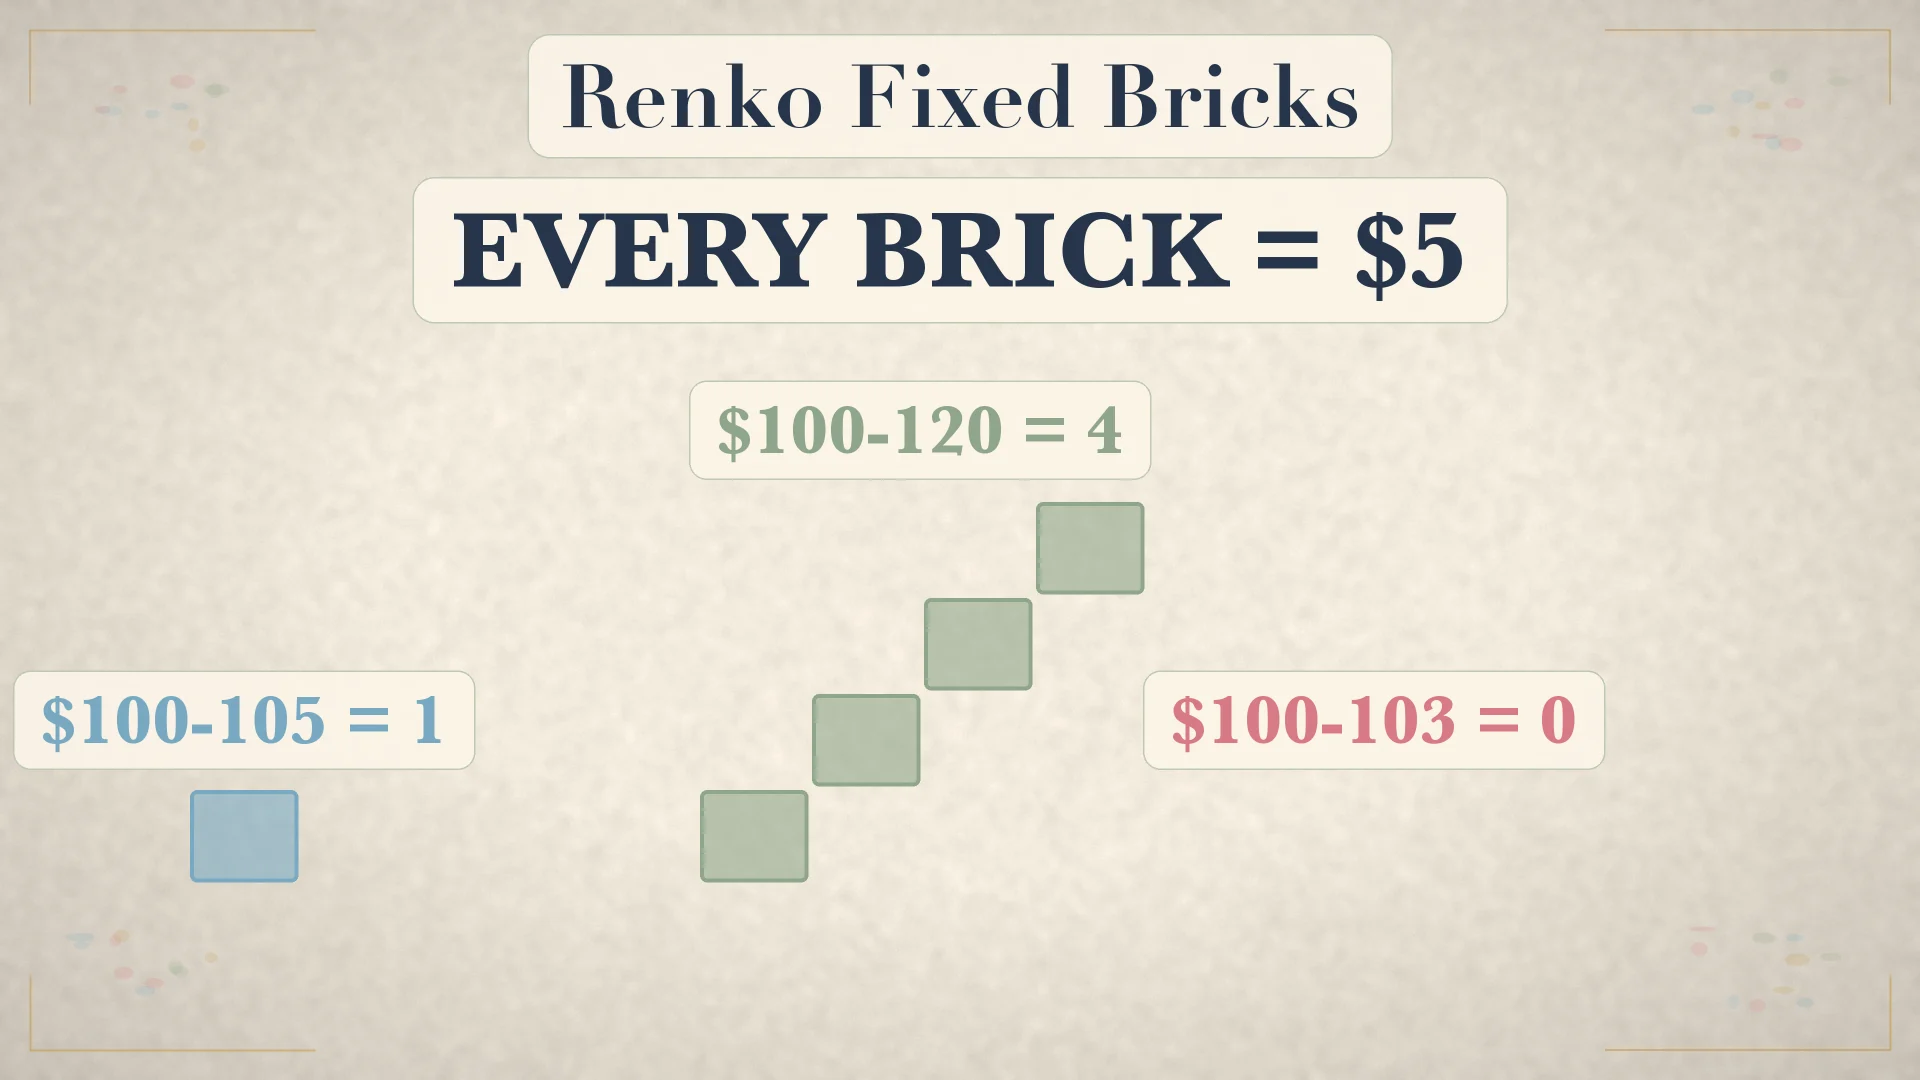
Choose brick size B; every brick has height B. In Nison's worked fixed example, B=5 points, so a 20-point rise creates four up bricks. A sub-brick move creates no brick. From an established up brick, continuation needs another B beyond the far edge. Opposite bricks cannot be placed beside the last brick, which creates the standard two-brick reversal requirement. [1][5]
Worked fixed-brick sequence
- Use
B=$5and an anchor at $100. - A move from 100 to 103 is less than one brick: draw zero.
- A move to 105 completes one up brick, 100→105.
- A continued move to 120 completes four up bricks in total.
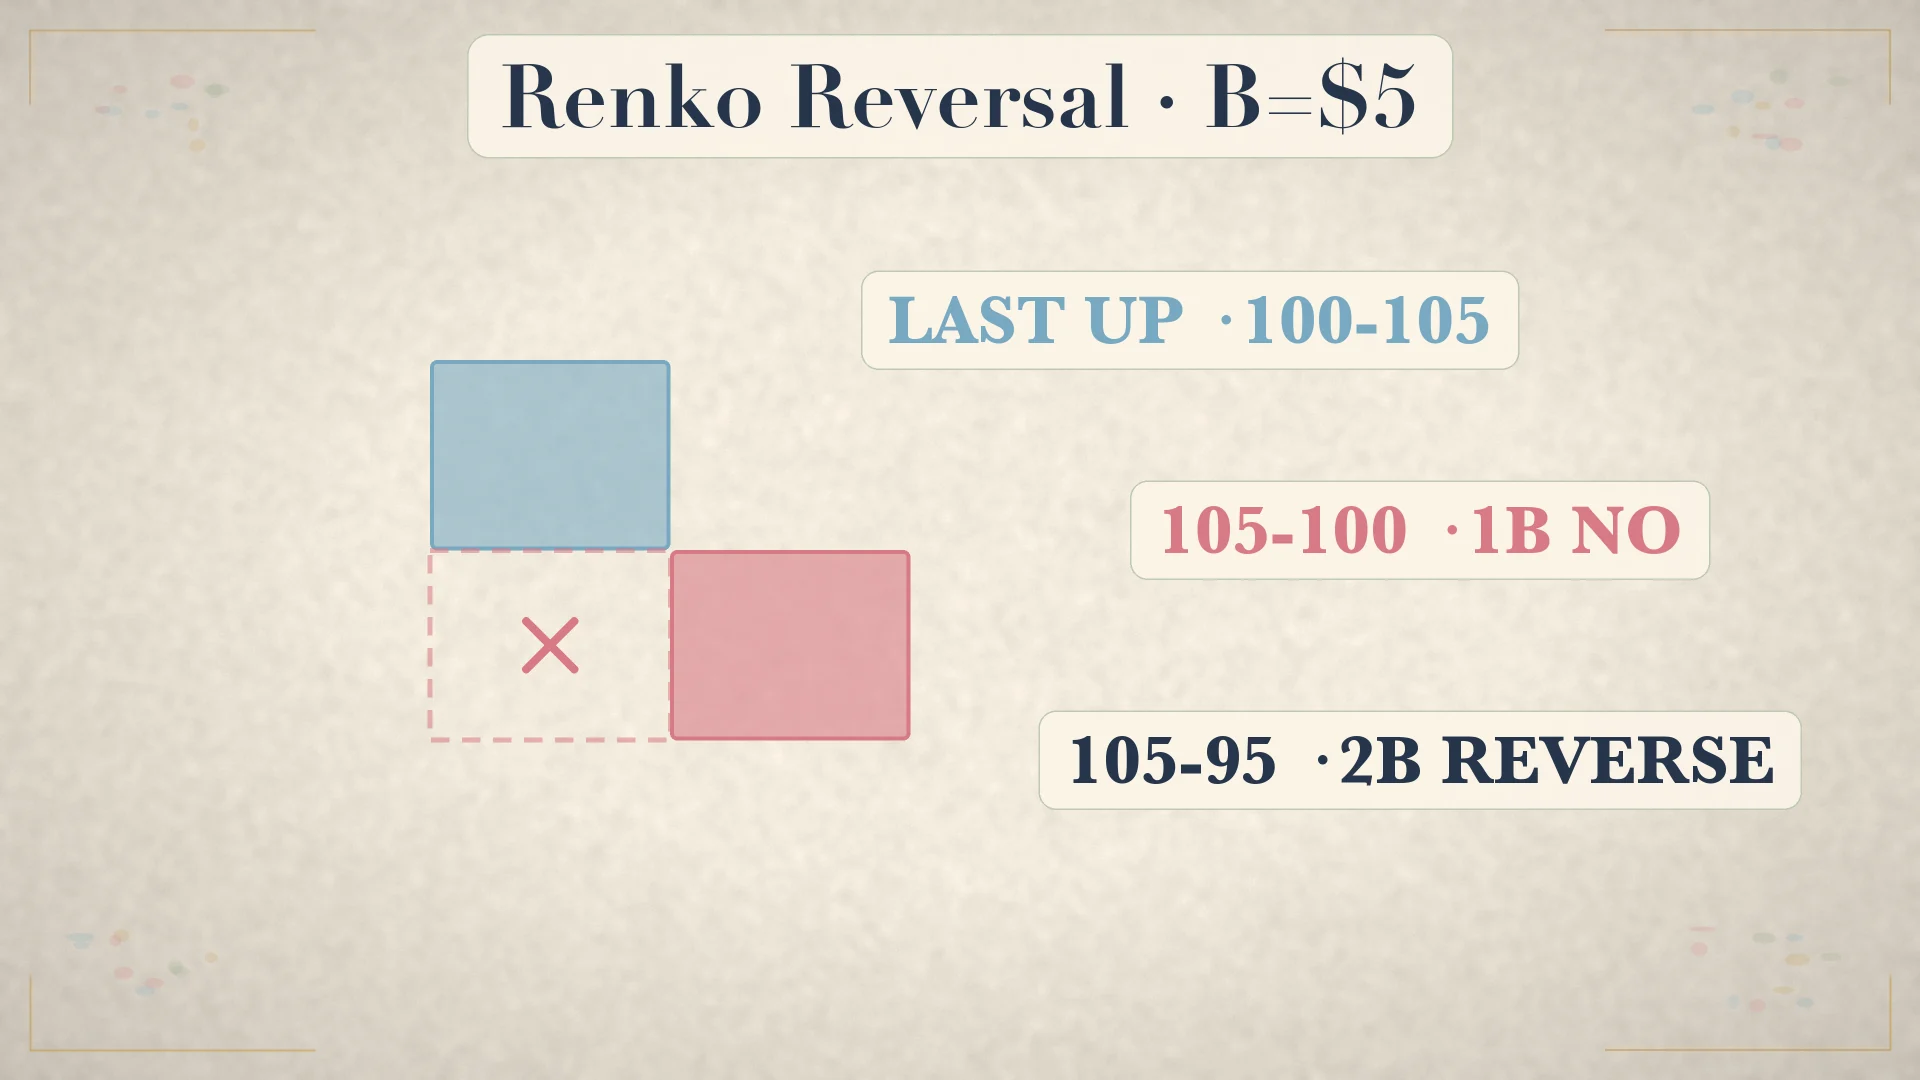
- If the last up brick is 100→105, a decline to 100 is only 1B from the last close and draws no down brick.
- A decline to 95 is 2B from 105; the first down brick spans 100→95.
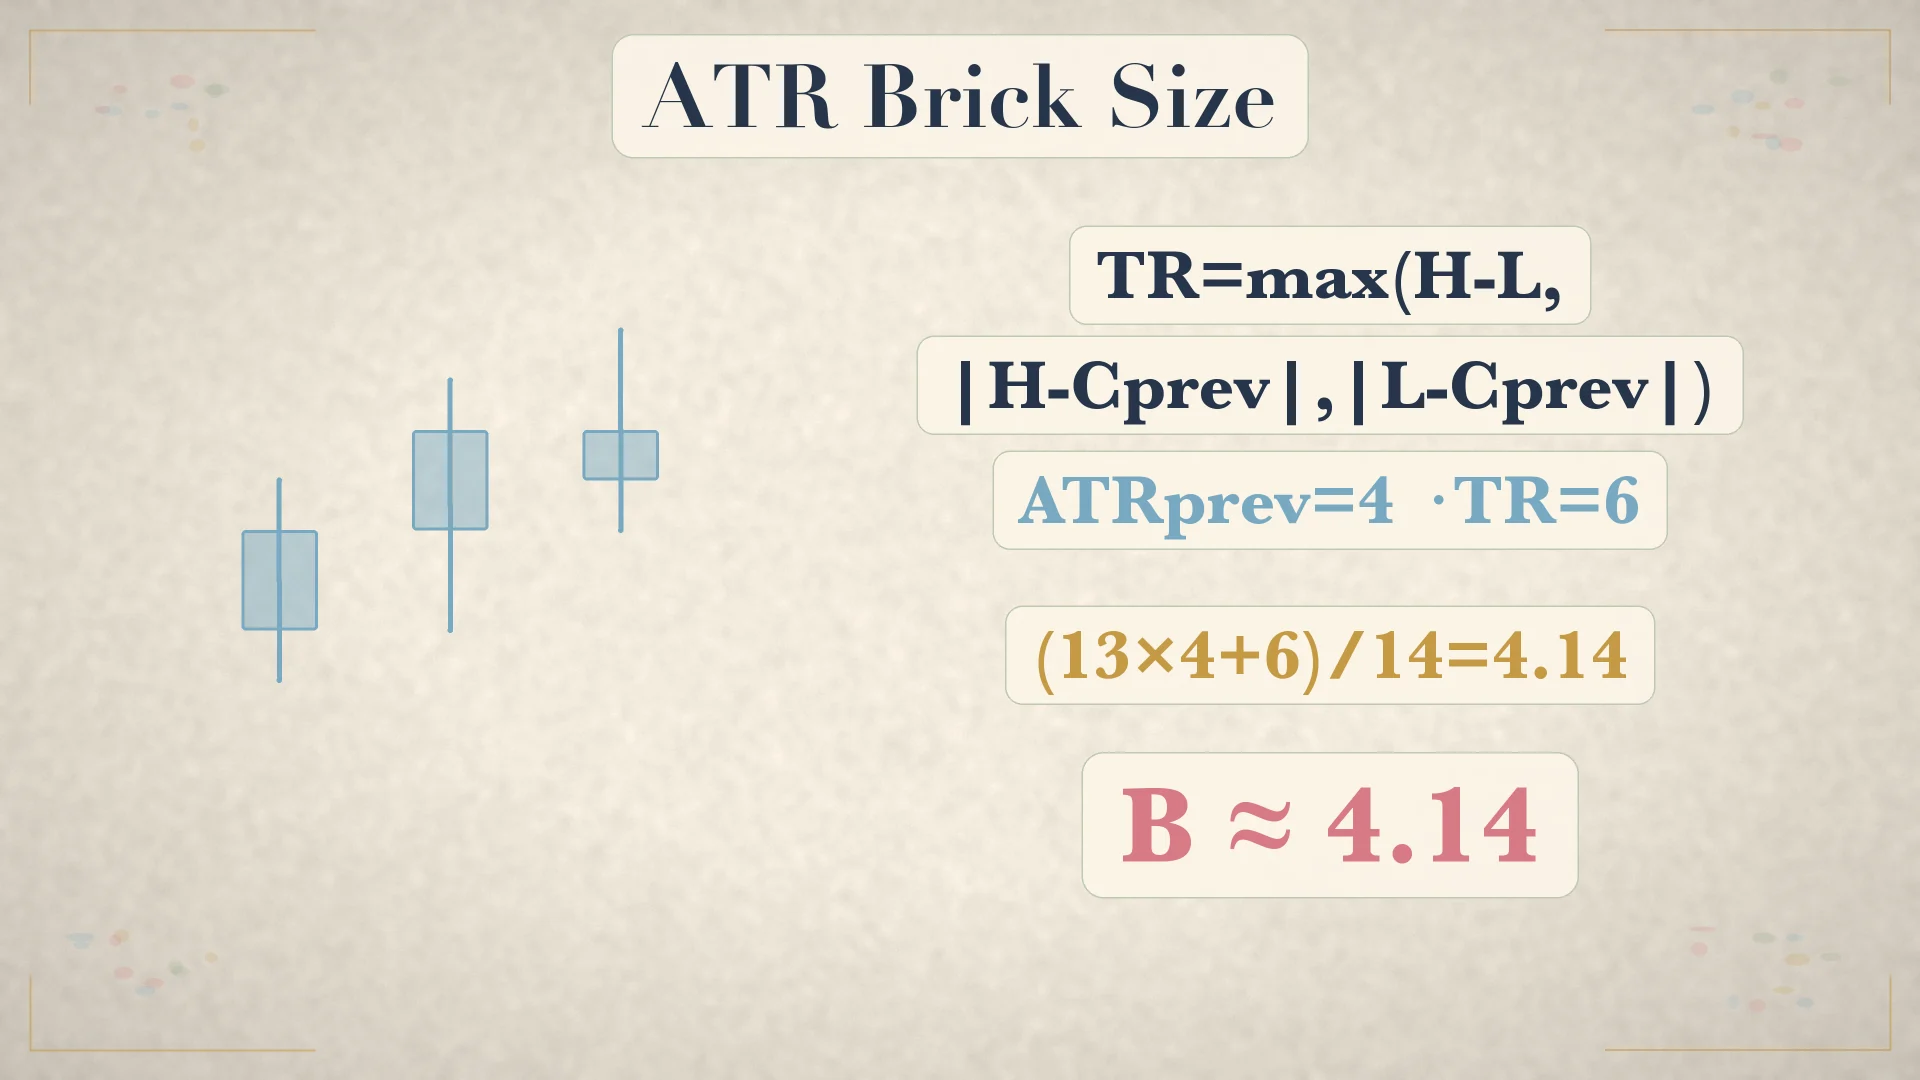
Some platforms choose an adaptive brick B_t=ATR_14. Compute TR=max(H−L,|H−C_prev|,|L−C_prev|), seed ATR with the mean of 14 TR values, then update ATR_t=(13×ATR_prev+TR_t)/14. With ATRprev=4 and TR=6, new ATR is (52+6)/14=4.142857, displayed near 4.14 after tick rounding. This is a modern platform option, not Nison's original fixed-brick example. [5][6]
Adaptive bricks change as volatility changes, so the platform's recomputation policy matters. Historical bricks may be recalculated or remain fixed depending on implementation. That is one reason synthetic Renko prices are unreliable assumed fills in a backtest: the displayed brick boundary is a constructed threshold, not necessarily a tradable tick sequence.
Three-Line Break: new extremes and a three-line reversal
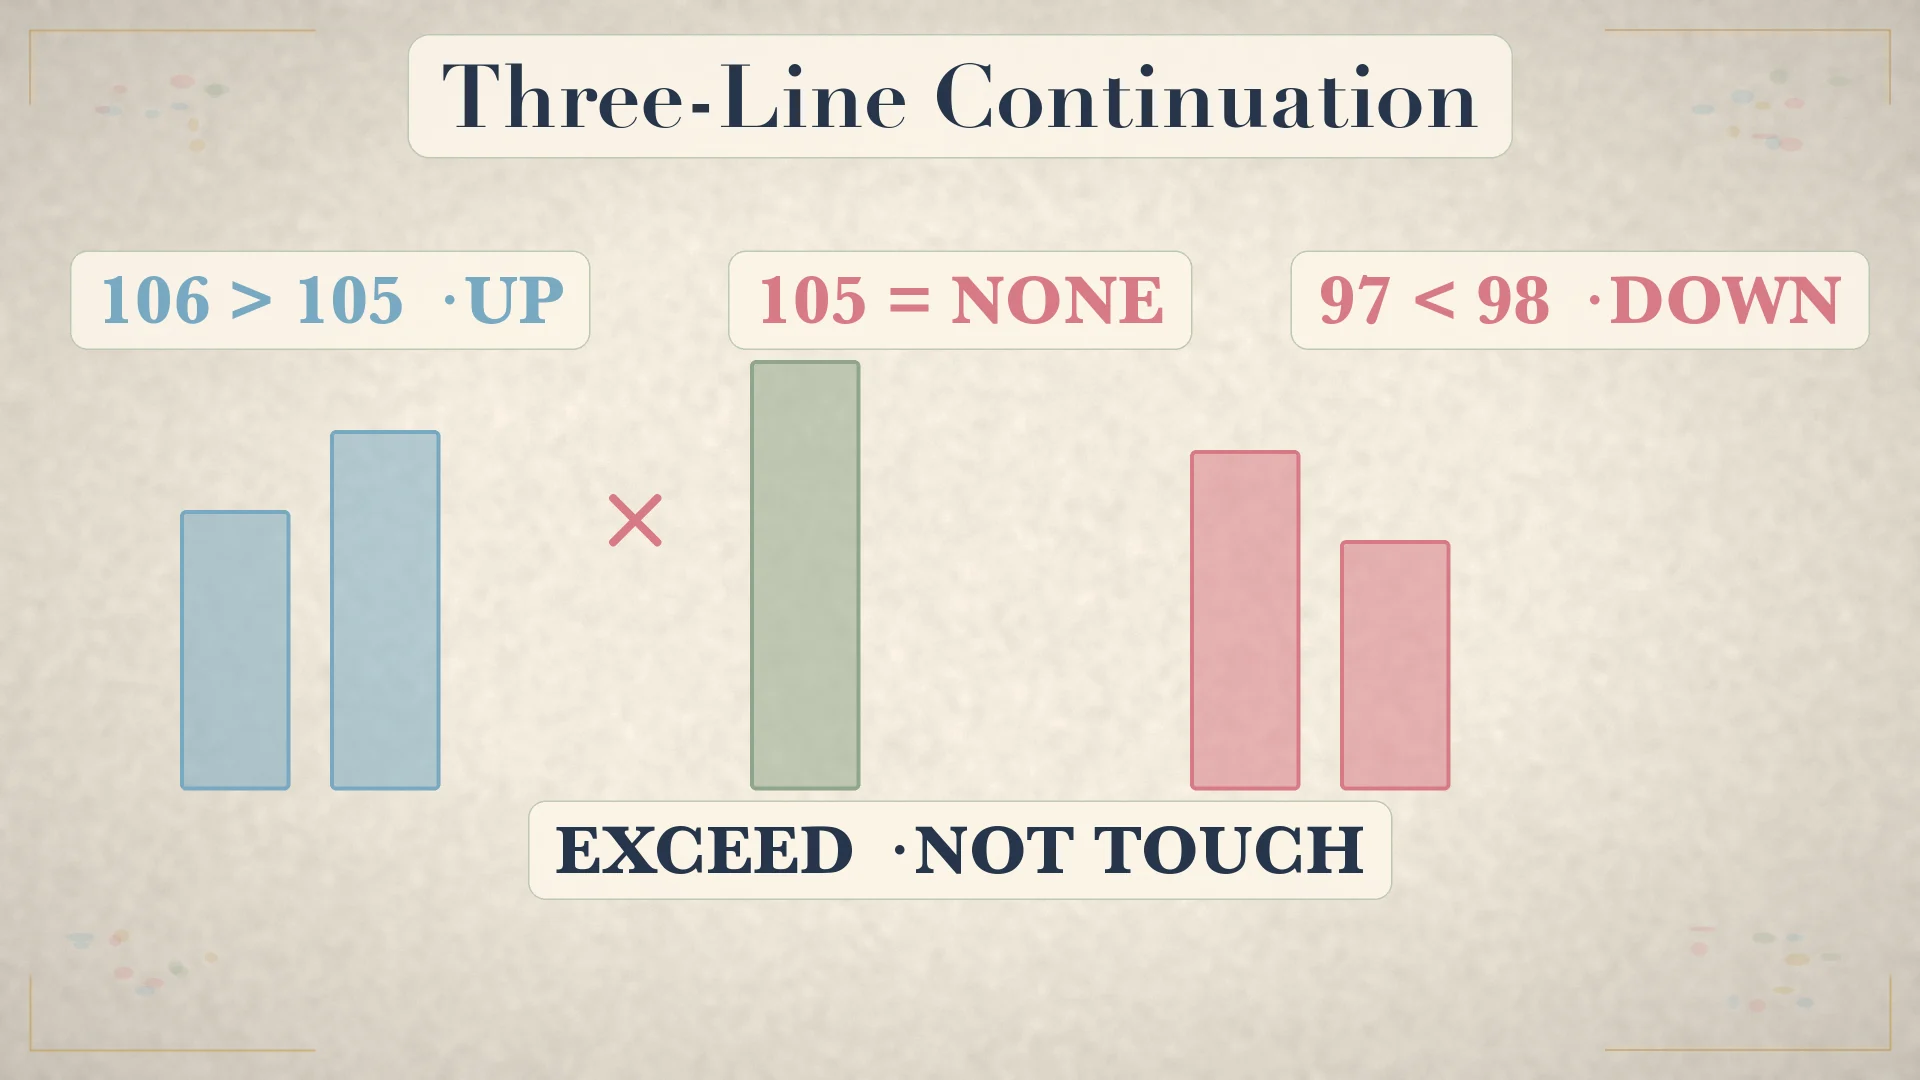
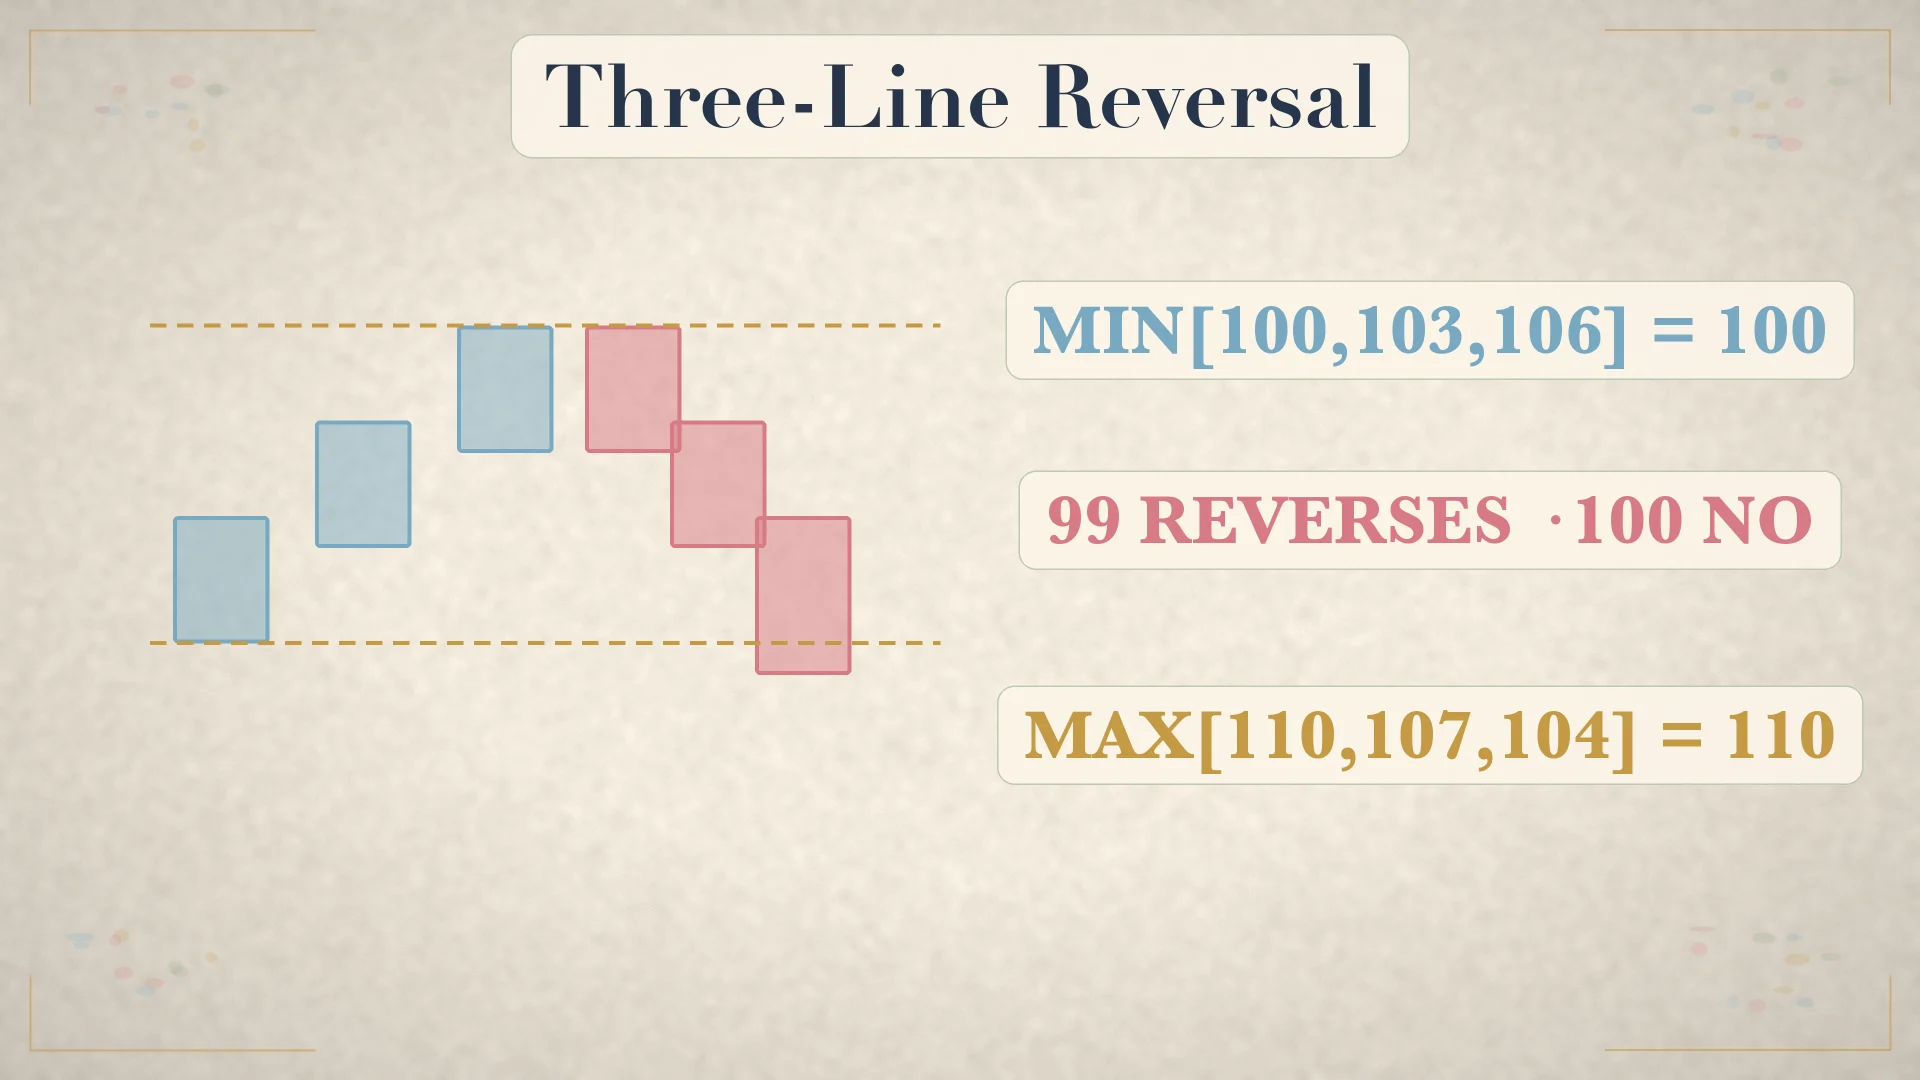
Three-Line Break commonly uses closes and has no fixed point reversal amount. In the current direction, add an up line only when the close is above the prior high; add a down line only when the close is below the prior low. Equality is not enough. After three same-direction lines, the reversal threshold comes from the extreme across those last three lines. [1][4]
Worked continuation and reversal
- If the last up-line high is 105, a close at 105 draws nothing; a close at 106 adds an up line.
- If the last down-line low is 98, a close at 97 adds a down line.
- Now suppose the lows of three up lines are
[100,103,106]; their minimum is 100. - A close at 100 only touches the threshold and does not reverse.
- A close at 99 is below 100 and draws the down reversal line.
- For three down-line highs
[110,107,104], a close above their maximum—111, not 110—reverses upward.
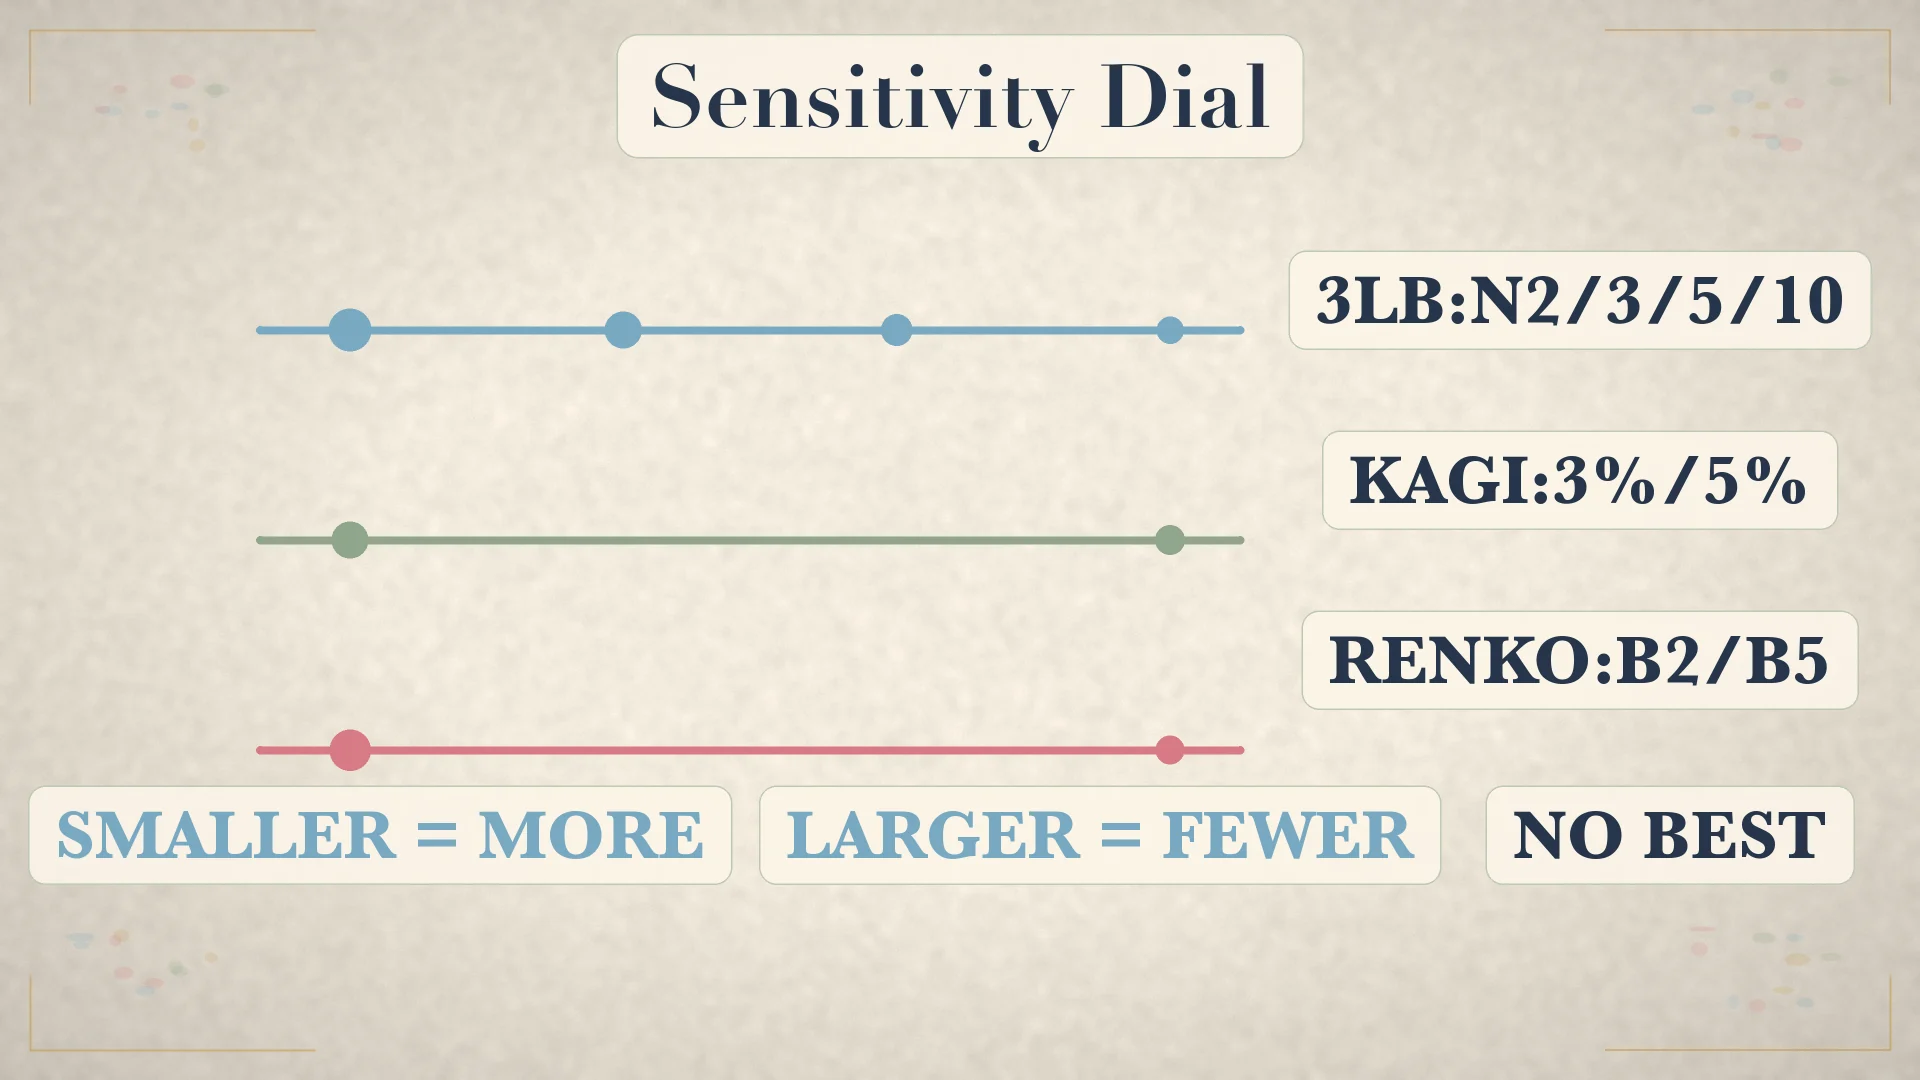
Nison described three lines as the most popular Japanese setting. Two or three lines respond faster; five or ten seek larger, slower moves. Smaller N generally means more marks and faster flips, while larger N means fewer marks and more delay. Neither setting is “best” without a specified instrument, data source, costs and objective.
A sensitivity comparison, not an optimization claim
Take the same close sequence: 100, 102, 104, 103, 101, 105, 107, 104. A small Kagi R or Renko B can react to several of the two- and three-point moves; a larger threshold can suppress them. A 2-line break reverses with less contrary evidence than a 5- or 10-line break. The correct lesson is monotonic: smaller thresholds usually create more marks and faster changes; larger thresholds usually create fewer marks and more delay. The sequence does not prove which setting will be profitable.
Use one as a trend filter, then return to an execution chart
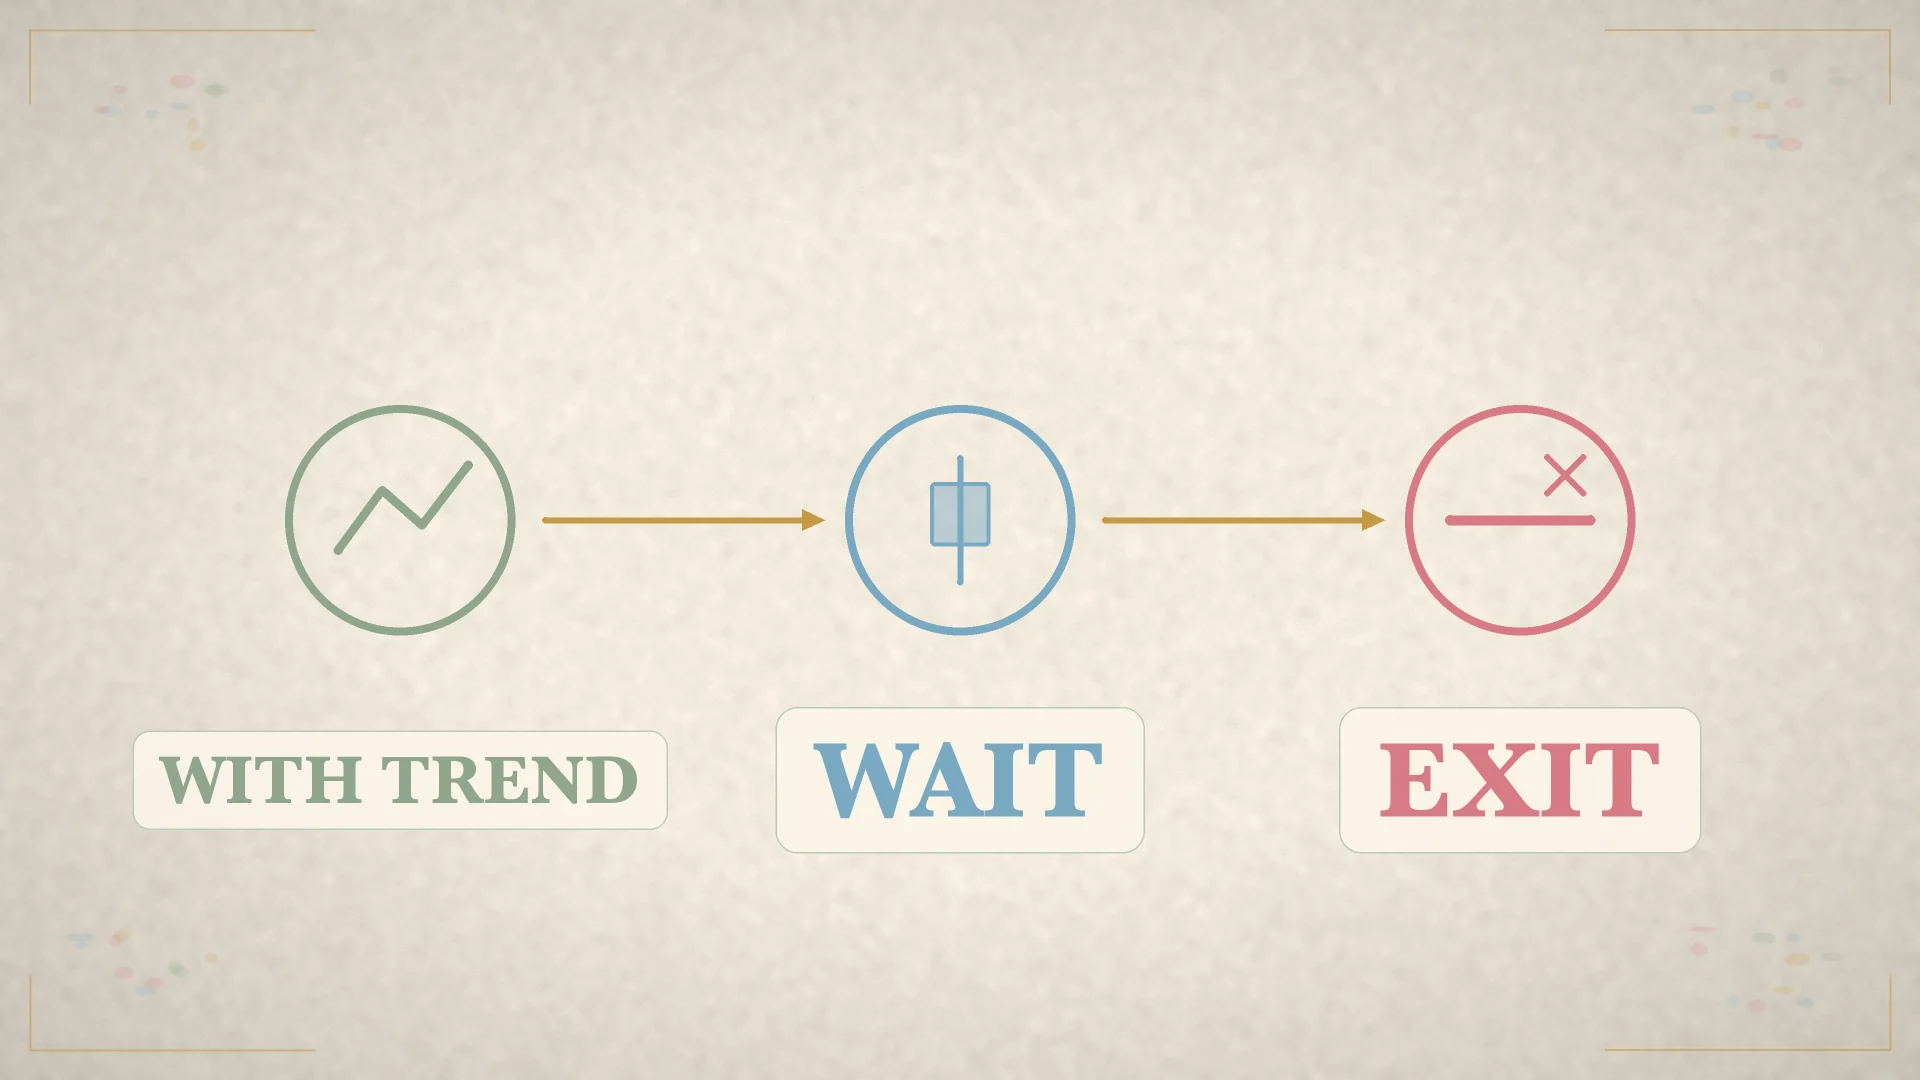
These charts can organize prevailing direction: Kagi yang/yin, Renko up/down bricks, or Three-Line Break up/down lines. A disciplined educational workflow chooses one—not all three as votes—and uses it only as a filter. Nison explicitly described Three-Line Break as a trend filter with candlesticks providing the entry mechanism. [1]
- Fix the construction rules before looking at the outcome.
- Label the filter state
WITH TREND,WAIT, orEXIT. - On a separate time-based price chart, define the entry trigger and confirm that the source price actually traded there.
- Place the educational stop at a price-structure invalidation point or by a separately defined risk rule.
- Size from the entry-to-stop risk, then test costs, gaps and the exact platform implementation.
Example: a Renko filter is in up-brick mode, but the time chart has not broken the chosen entry high. The state is wait, not buy. If the time chart breaks the level and later closes beneath the predefined structure low, the setup is invalidated even if the synthetic brick display lags. The price chart governs execution because it preserves time and actual market levels.
A stop should not be placed at a synthetic brick solely because the rectangle looks precise. Suppose the filter's up brick ends at 105 but the time chart shows the actual structural low at 101.80. If the educational rule uses price structure, 101.80 is the invalidation reference; if it uses a fixed cash or volatility rule, calculate that rule explicitly. Mixing the two after entry makes the test impossible to reproduce.
Common mistakes and honest limits
- Claiming a precise inventor or Dojima birthplace not established by the cited sources.
- Calling these charts time-free and then forgetting that source-bar timing affects construction.
- Treating 3% Kagi, B=5 Renko or N=3 Line Break as universal defaults.
- Forgetting strict exceed/break rules and accepting a touch as a new mark.
- Using a one-brick Renko decline as a reversal when the standard construction needs 2B.
- Mixing close-based rules with high/low data without documenting the change.
- Assuming synthetic Renko boundaries were executable fills.
- Optimizing a threshold on the same sample used to judge it.
All three methods can whipsaw in sideways markets. They cannot restore elapsed time, volume or the exact tick path after those fields have been compressed. Starting anchor, rounding and platform details can materially change the picture. A clean chart can help enforce a rule, but it cannot prove profitable performance, predict the next mark or replace out-of-sample testing on actual price data.
Teaching diagrams
Glossary
- Non-linear time
- A chart where elapsed time alone creates no new mark.
- Kagi reversal amount
- Fixed points or percentage R required to turn the line.
- Shoulder / waist
- Prior Kagi high / low used to change line weight.
- Renko brick
- An equal price block of size B.
- Two-brick reversal
- The standard 2B move needed to reverse from the last Renko close.
- Three-Line Break
- A close-driven chart that reverses beyond the extreme of recent lines.
Frequently asked questions
Do these charts ignore time completely?
Time still passes, but it does not force a mark. A price condition does.
Is 3% the best Kagi setting?
No. It is a historical working setting reported by Nison, not a universal optimum.
Why does Renko need 2B to reverse?
Opposite bricks cannot sit beside the last brick, so the first opposite brick needs a two-brick move from the last close.
Can synthetic Renko prices be used as fills?
They are unreliable as assumed backtest fills; use a separate price series and execution model.
Sources
- Steve Nison, Beyond Candlesticks — books.google.com
- Japan Exchange Group: Dojima Rice Exchange — www.jpx.co.jp
- Japan Exchange Group: history of Japan's exchanges — www.jpx.co.jp
- Nippon Technical Analysts Association technical handbook — www.ntaa.or.jp
- TradingView: Understanding Renko charts — www.tradingview.com
- StockCharts ChartSchool: True Range — chartschool.stockcharts.com
Educational content only — not financial advice or a promise of performance.