
From Wyckoff's Composite Man to a 2020s vocabulary
Smart Money Concepts (SMC) is a vocabulary for reading a price chart around one question: where are other traders' orders likely to be resting, and what does price tend to do when it reaches them? Many of its ideas are older than the branding, such as swing structure, support and resistance, supply and demand, and Wyckoff's "Composite Man". This guide explains the core terms in the order traders usually apply them, walks through one hypothetical example with numbers, and ends with what SMC cannot do. It is the source text for the song "Where the Stops Sleep" on the album Spoken Trading.
"Smart money" is a loose market term for capital run by institutions, hedge funds, central banks and other professionals who are believed to be better informed than the average retail trader. The phrase began in gambling, for bettors with better knowledge, and Investopedia notes there is little proof that smart money actually outperforms. [1]
Reading the footprints of large operators is an old idea. Richard D. Wyckoff (1873–1934) taught students to study every market move as if one "Composite Man" planned it: he accumulates a large line of shares, marks prices up, attracts the public to buy from him, then marks prices down. It is a teaching device, not a real person. [2] The track "The Tape Doesn't Lie" on the same album tells Wyckoff's story.
Much of today's SMC vocabulary was popularized by the educator known as ICT (Inner Circle Trader, Michael J. Huddleston). He taught free on the BabyPips forum for about three years until early 2013, and in 2022 ran a free 41-video YouTube series. [3] [4] [24] Over the 2010s and early 2020s the umbrella label "Smart Money Concepts" spread through YouTube, TradingView and Discord communities; LuxAlgo's "Smart Money Concepts" indicator, published on TradingView in October 2022, made the terms easy to plot. [4] [5] There is no official rulebook. Definitions differ between teachers, so this guide uses the common versions and says where they vary.
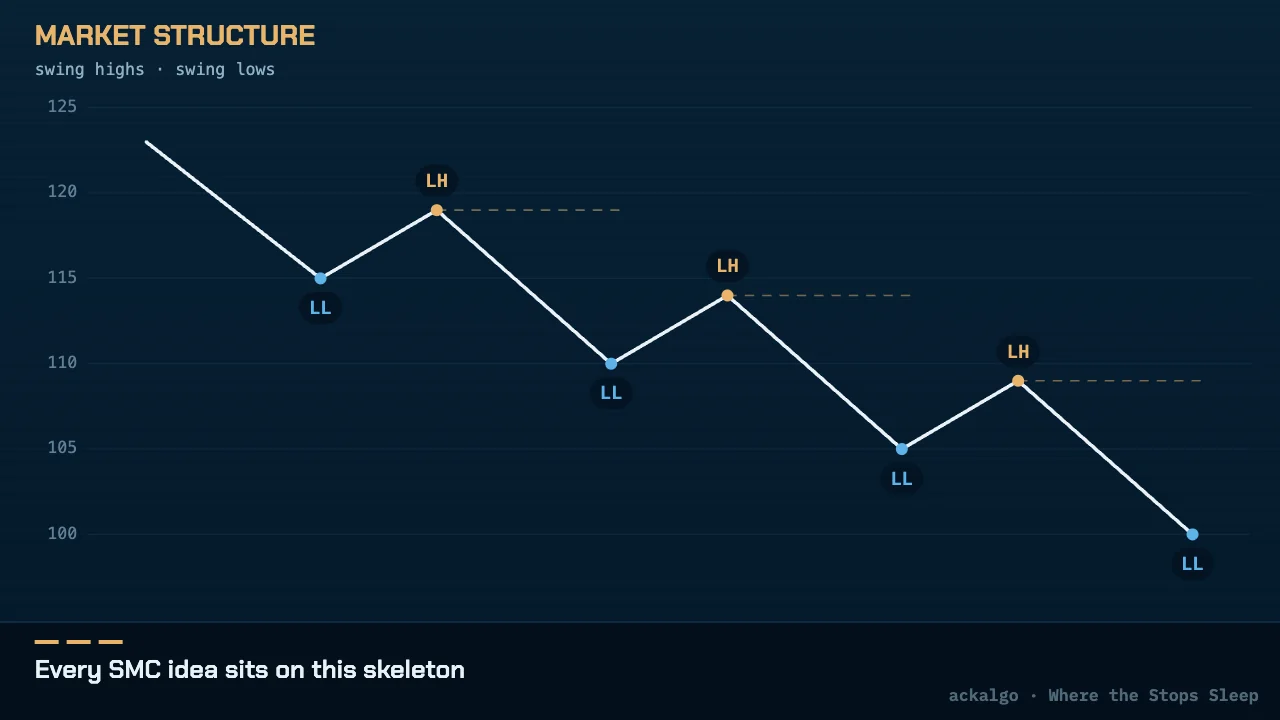
Structure first: swing points, break of structure, change of character
Everything in SMC sits on market structure. An uptrend prints rising peaks and troughs (higher highs, HH, and higher lows, HL); a downtrend prints falling ones (lower highs, LH, and lower lows, LL). [6] A swing high is a bar whose high is above the bars on both sides; ICT-style teaching often uses a 3-bar or 5-bar version of that rule. [3]
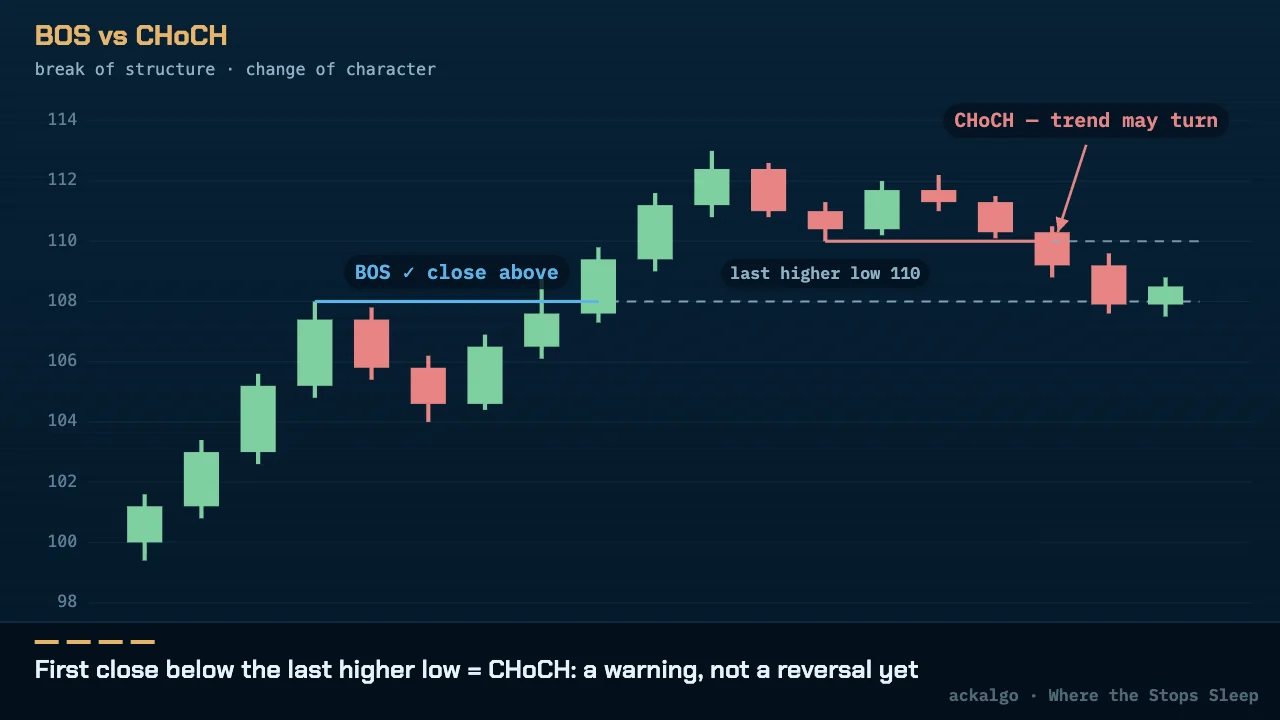
A break of structure (BOS) is a break in the trend's own direction: price trades through the latest significant swing high in an uptrend, or swing low in a downtrend, and the move is read as continuation. Many traders only count it when a candle body closes beyond the swing; a wick that pokes through and closes back inside reacts earlier but often turns out to be a sweep. [7] [23]
A change of character (CHoCH) is the first break against the trend: in an uptrend, price closes below the last higher low; in a downtrend, above the last lower high. Treat it as a warning, not a reversal. A lone CHoCH often fails. Some teachers use "market structure shift" (MSS) as a synonym; others keep MSS for a counter-trend break with displacement right after a sweep. [8]
Liquidity: where the stops sleep
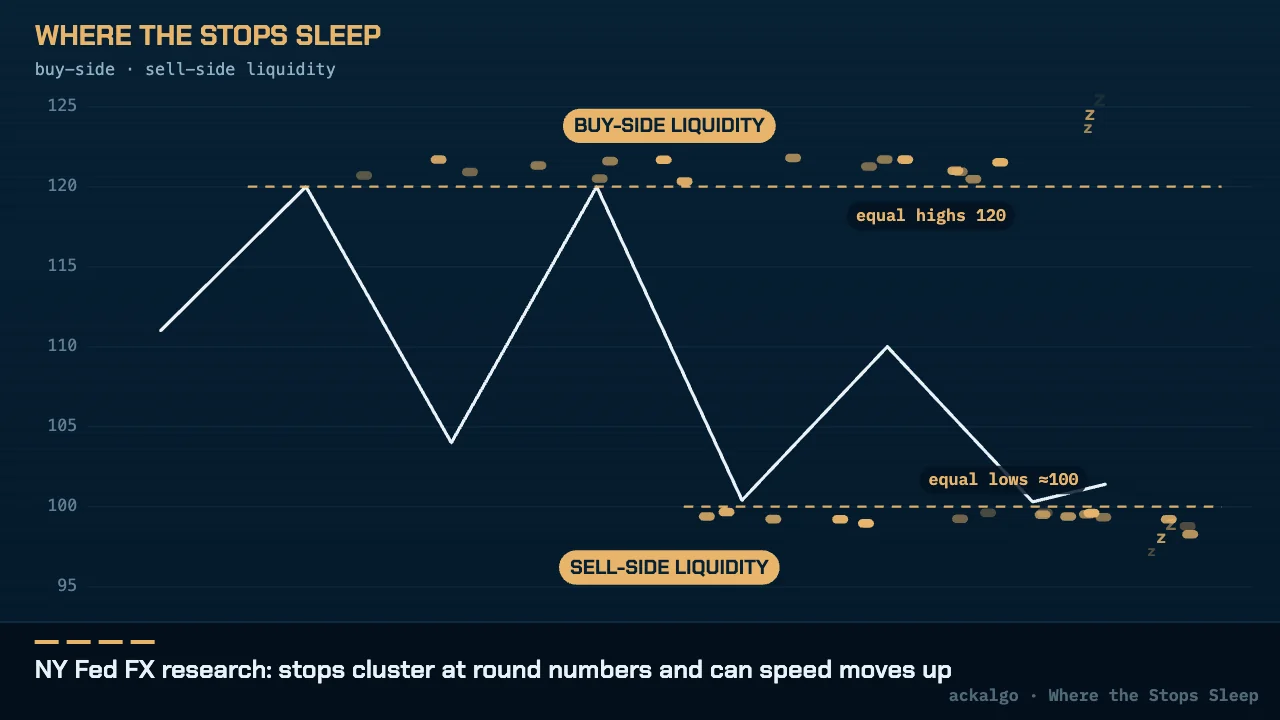
In SMC, "liquidity" means resting orders. Above an obvious high sit buy orders: the stop-losses of traders who are short (a stop on a short is a buy order) plus the buy-stop entries of breakout traders. That pool is buy-side liquidity. Below an obvious low sits the mirror, sell-side liquidity: long traders' stop-losses and breakout sell orders. Equal highs and equal lows are treated as denser, more visible pools, though price does not have to take them. [9] Other levels traders watch include the previous day's and week's highs and lows and session ranges. [4]
There is real evidence behind part of this idea. Research at the Federal Reserve Bank of New York, using one dealing bank's FX order book, found that stop-loss and take-profit orders cluster at round numbers, that stop-losses tend to intensify trends, and that rates move unusually fast when they hit stop clusters ("price cascades"). [10] [11] That shows clustering and acceleration. It does not show that anyone targets your stop.
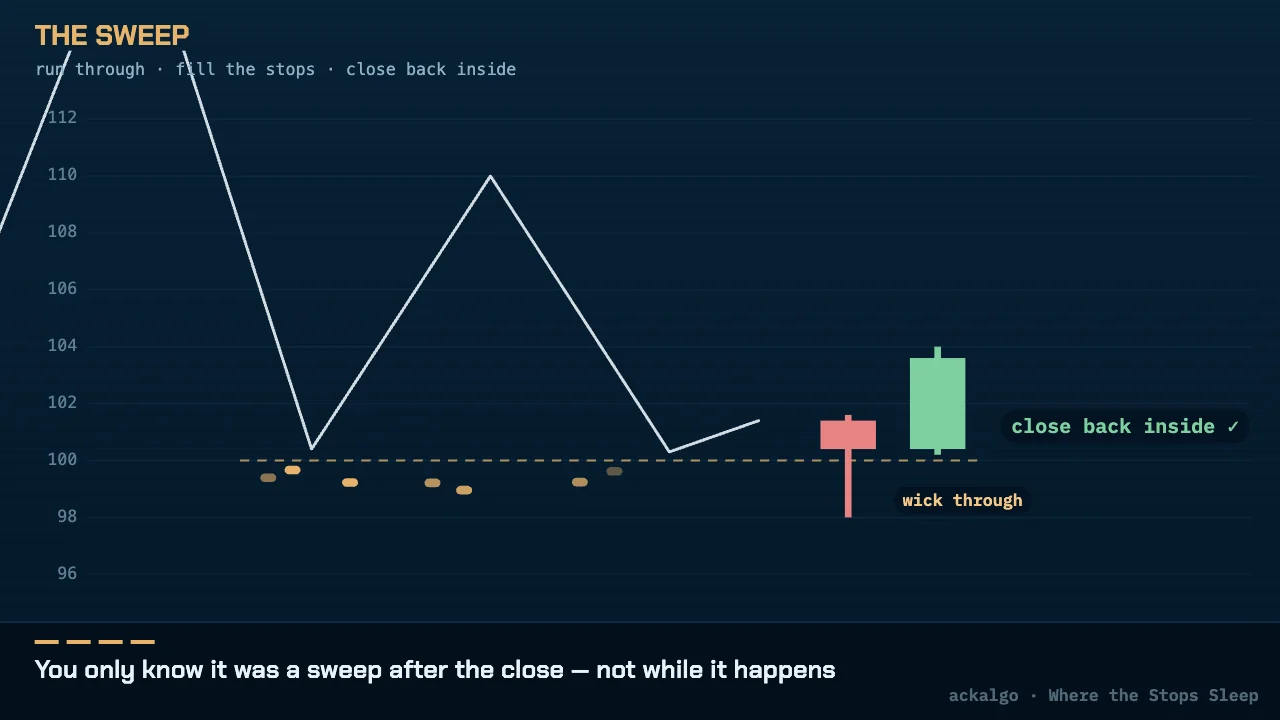
A liquidity sweep (also called a grab, stop hunt, stop run or raid) is a run through an obvious high or low where stops rest. The classic form is a wick through the level and then a close back inside the range. You only know whether it was a sweep or a real breakout after the candle closes. [12] Inducement is the name for a smaller, more obvious pullback high or low in front of the level a trader really wants, expected to be swept first. The term is loosely defined and intent cannot be proven from a chart. [21]
Footprints: displacement, fair value gaps and order blocks
Displacement is a fast, one-way run of large-bodied candles with small wicks. There is no fixed threshold; it is judged against recent price action, and it usually leaves fair value gaps behind. [13]
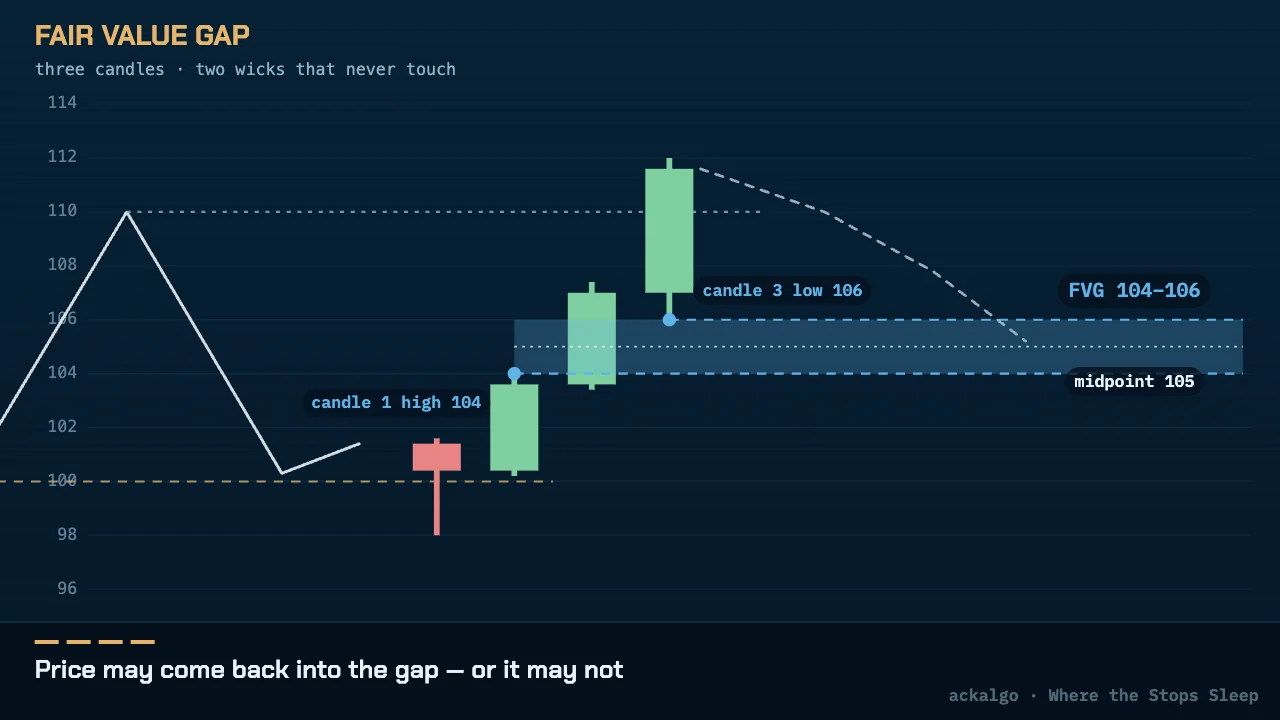
A fair value gap (FVG) is a three-candle pattern. It is bullish when the low of candle 3 is above the high of candle 1, so the two wicks never touch and only the middle candle traded through that space. It is bearish when the high of candle 3 is below the low of candle 1. "Imbalance" is used as a near-synonym. The gap's 50% midpoint is called consequent encroachment (CE). [14] [15] Not every gap fills [14], and there are no independent statistics behind CE. [15]
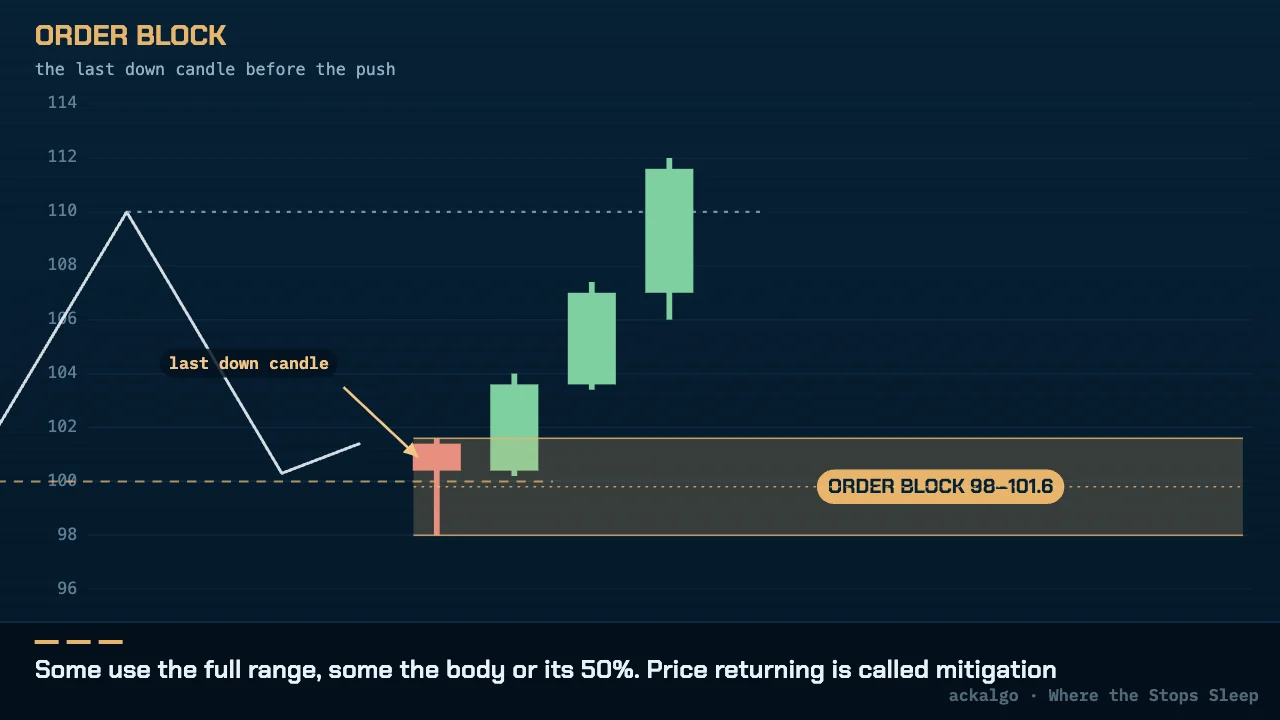
An order block (OB) is the last down-close candle, or group of candles, before an impulsive rally (bullish); the bearish version is the last up-close candle before an impulsive drop. Sources disagree on the details: whether a BOS or an FVG is required, and whether the zone is the full candle range, the body only, or its 50% "mean threshold". Price returning into the zone is called mitigation. There is no universal hit rate, and the claim that institutions opened positions there cannot be verified. [16] [4] [19]
Location: premium, discount and the 50% line
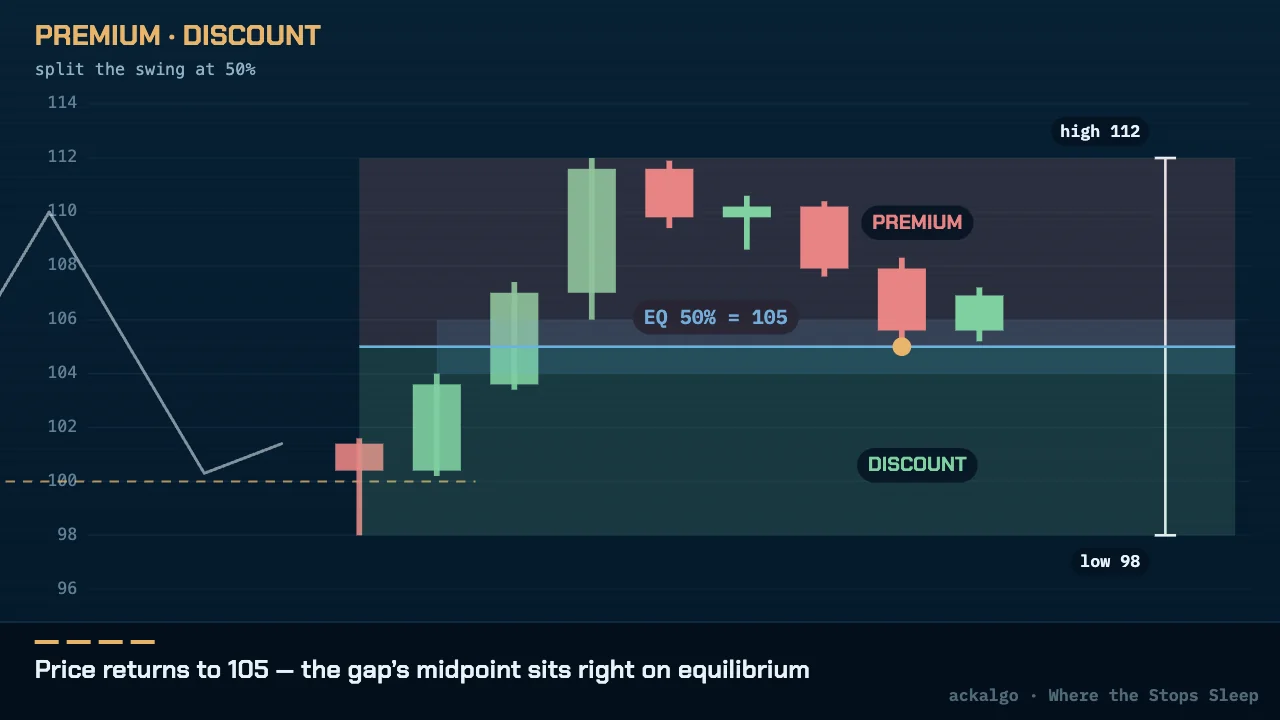
SMC adds a filter for where to act. Take the dealing range, meaning the latest meaningful swing leg, and split it at 50%, the equilibrium. Prices above 50% are "premium" and prices below are "discount". The rule of thumb is to look for buys only in discount and sells only in premium. [17] ICT-style courses narrow this further to an "optimal trade entry" (OTE) band at roughly the 62%–79% retracement, with 70.5% as a "sweet spot". Treat those numbers as teaching conventions, not market constants. [18] [3]
Some courses also add "kill zones", session windows such as the London open and the New York morning, but sources differ by 30 to 90 minutes and daylight saving shifts them, so always state the time zone. [22]
Putting it together: one hypothetical walk-through
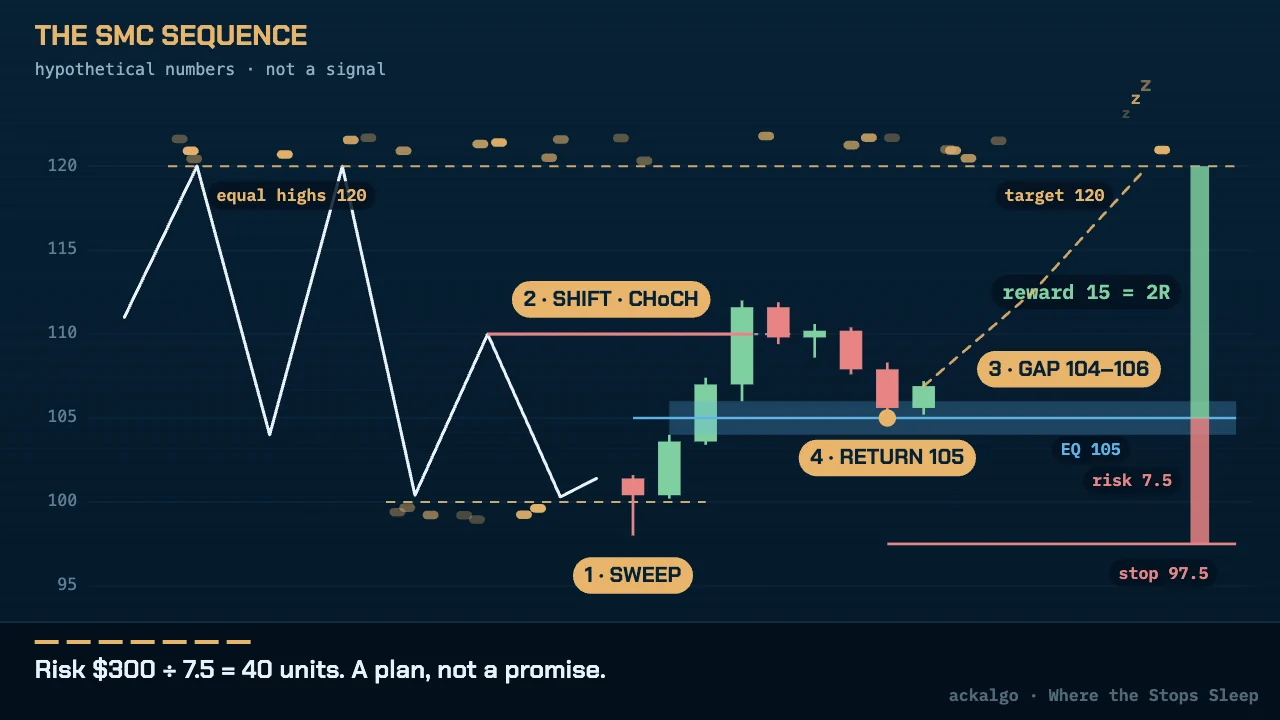
The sequence usually taught is: set a higher-timeframe bias from swings and BOS; mark resting liquidity; wait for a sweep that rejects; look for displacement the other way that breaks structure; enter at the move's origin (an order block or FVG, often inside the OTE band); put the stop beyond the sweep's extreme and target the opposite liquidity. [4] It is a workflow, not a validated strategy. The numbers below are invented for teaching. They are not a market call and they have not been backtested.
- Range: price has traded between 100 and 120. Equal highs at 120 hold buy-side liquidity; equal lows near 100 hold sell-side liquidity.
- 1 · Sweep: a candle wicks to 98, fills the sell stops, and closes back above 100.
- 2 · Shift: displacement closes above 110, the last lower high of the drop from 120 (a change of character), and tops at 112.
- 3 · Gap: inside that rally, candle 1's high is 104 and candle 3's low is 106, so there is a bullish FVG from 104 to 106 with its midpoint at 105.
- Location: the new dealing range runs from 98 to 112, so equilibrium is
(98 + 112) / 2 = 105. The gap's midpoint sits exactly on the 50% line: its lower half (104–105) is in discount, its upper half in premium. An entry at 105 is at equilibrium, the shallowest possible spot, not deep in discount. - 4 · Return: price trades back down to 105.
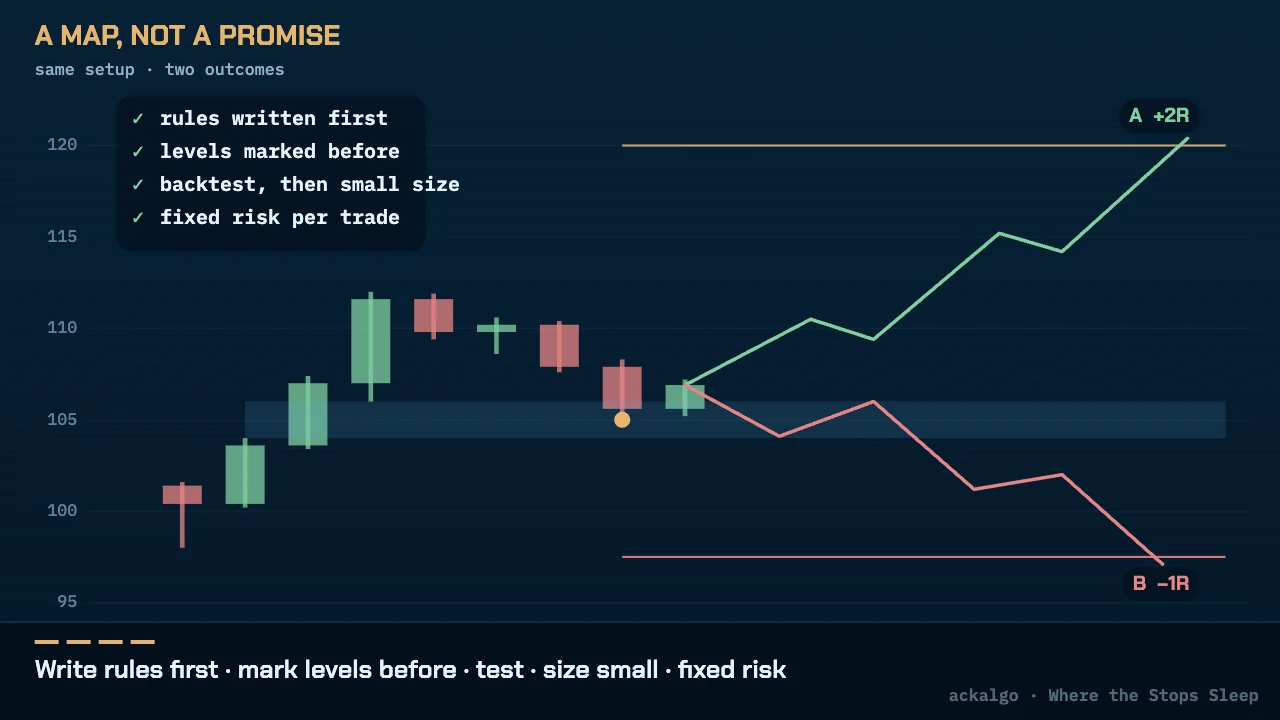
- Plan: entry 105, stop 97.5 (below the sweep low), so the risk is 7.5 per unit. Target 120 (the equal highs) gives a reward of 15, so reward-to-risk is
15 / 7.5 = 2.0. - Size: if one point is worth $1 per unit and the plan risks $300, the size is
300 / 7.5 = 40 units(before spread, commission and slippage). - Note: 105 is a 50% retracement. The ICT OTE band for this leg (62–79%) would sit around 100.9–103.3, so this example uses the shallower gap entry, not OTE. [18]
What the example cannot show: whether price returns to 105 at all, whether an order fills there, or whether 98 was the low. Those answers only exist on a finished chart.
What SMC cannot do
- No proven edge. Even LuxAlgo, which publishes SMC indicators, writes that these concepts do not guarantee you are trading alongside institutional liquidity and that "there is no supporting data regarding the validity of these teachings". [5] Academic evidence is thin. One 2026 peer-reviewed study used SMC-detected events inside a machine-learning system on hourly gold data and reported better results than a rules-only baseline, but it covers a single market and its headline return comes from the development (in-sample) period. [20]
- Nobody sees the whole order book. Spot FX trades over the counter through dealers and is decentralised and fragmented, so there is no single central book for a retail trader to read. [19] SMC zones are inferences from price, not visible institutional orders, and "they hunted my stop" is a story about a move, not something a chart can prove.
- Zones are subjective. Mixing order-block conventions lets a zone be redrawn to fit hindsight, a sweep is only known after the close, displacement has no threshold, and inducement intent cannot be proven. [16] [12] [13] [21]
- Critics argue that much of it is older material renamed: Wyckoff's Composite Man, supply and demand zones, false breakouts and stop runs. [4]
How to use it responsibly: write the rules down before the move (what counts as a sweep, a break and a zone), mark levels before price gets there, test on past data and then with a small live size, and fix the risk per trade in advance. This article is educational and is not financial advice.
Teaching animations
Nine coded animations from the film, drawn live in your browser by the same script that rendered its chart scenes. Each one sits under the section it teaches. Prices are the article's hypothetical worked example, not market data.
Glossary
- Smart money
- Capital run by institutions and professionals believed to be better informed.
- Market structure
- The sequence of swing highs and lows (HH/HL up, LH/LL down).
- Break of structure (BOS)
- A break of a swing point in the trend's direction; read as continuation.
- Change of character (CHoCH)
- The first break against the prevailing structure; a warning.
- Buy-side / sell-side liquidity
- Resting buy orders above highs / sell orders below lows.
- Liquidity sweep
- A run through a level that fills resting orders and closes back inside.
- Inducement
- A minor high/low in front of the target level, expected to be swept first.
- Displacement
- A fast, one-way run of large-bodied candles.
- Fair value gap (FVG)
- Three-candle gap where candle 1's and candle 3's wicks do not overlap.
- Consequent encroachment (CE)
- The 50% midpoint of a fair value gap.
- Order block (OB)
- The last opposite candle before an impulsive move, used as a zone.
- Premium / discount
- The part of a dealing range above / below its 50% equilibrium.
Frequently asked questions
Is SMC what banks actually do?
Nobody can show that. It is a retail framework that describes price in institutional language, and spot FX has no single central order book for anyone to read.
What is the difference between BOS and CHoCH?
BOS breaks structure in the trend's direction (continuation); CHoCH is the first break against it (a warning).
Does price always fill a fair value gap?
No. Many gaps are only partly revisited or never revisited.
Do stop hunts really happen?
Stops do cluster at round numbers and can accelerate moves (NY Fed research), but that does not prove anyone targets a given stop.
Has SMC been proven to work?
Not by independent, replicated research; even a publisher of SMC tools says there is no supporting data. Test any rule set yourself first.
Sources
- Investopedia — Smart Money — www.investopedia.com
- StockCharts ChartSchool — The Wyckoff Method: A Tutorial — chartschool.stockcharts.com
- BabyPips forum — A glossary of ICT terms and abbreviations — forums.babypips.com
- LuxAlgo Library — Smart Money Concepts — www.luxalgo.com
- TradingView — Smart Money Concepts (SMC) [LuxAlgo] — www.tradingview.com
- StockCharts ChartSchool — Dow Theory — chartschool.stockcharts.com
- LuxAlgo Library — Break of Structure — www.luxalgo.com
- LuxAlgo Library — Change of Character — www.luxalgo.com
- LuxAlgo Library — Buy-side liquidity — www.luxalgo.com
- Federal Reserve Bank of New York — Staff Report 125 (Osler, 2001) — www.newyorkfed.org
- Federal Reserve Bank of New York — Staff Report 150 (Osler, 2002) — www.newyorkfed.org
- LuxAlgo Library — Liquidity sweep — www.luxalgo.com
- LuxAlgo Library — Displacement — www.luxalgo.com
- LuxAlgo Library — Fair value gap — www.luxalgo.com
- LuxAlgo Library — Consequent encroachment — www.luxalgo.com
- LuxAlgo Library — Bullish and bearish order blocks — www.luxalgo.com
- LuxAlgo Library — Premium and discount — www.luxalgo.com
- LuxAlgo Library — Optimal trade entry — www.luxalgo.com
- BIS Quarterly Review, December 2025 — FX market structure — www.bis.org
- Informatica, vol. 50 no. 13 (2026) — SMC/ICT events in an ML + LP trading system — www.informatica.si
- LuxAlgo Library — Inducement — www.luxalgo.com
- LuxAlgo Library — Killzones — www.luxalgo.com
- Dukascopy — Smart money concept — www.dukascopy.com
- YouTube — 2022 ICT Mentorship (playlist) — www.youtube.com
Educational content only — not financial advice or a promise of performance.